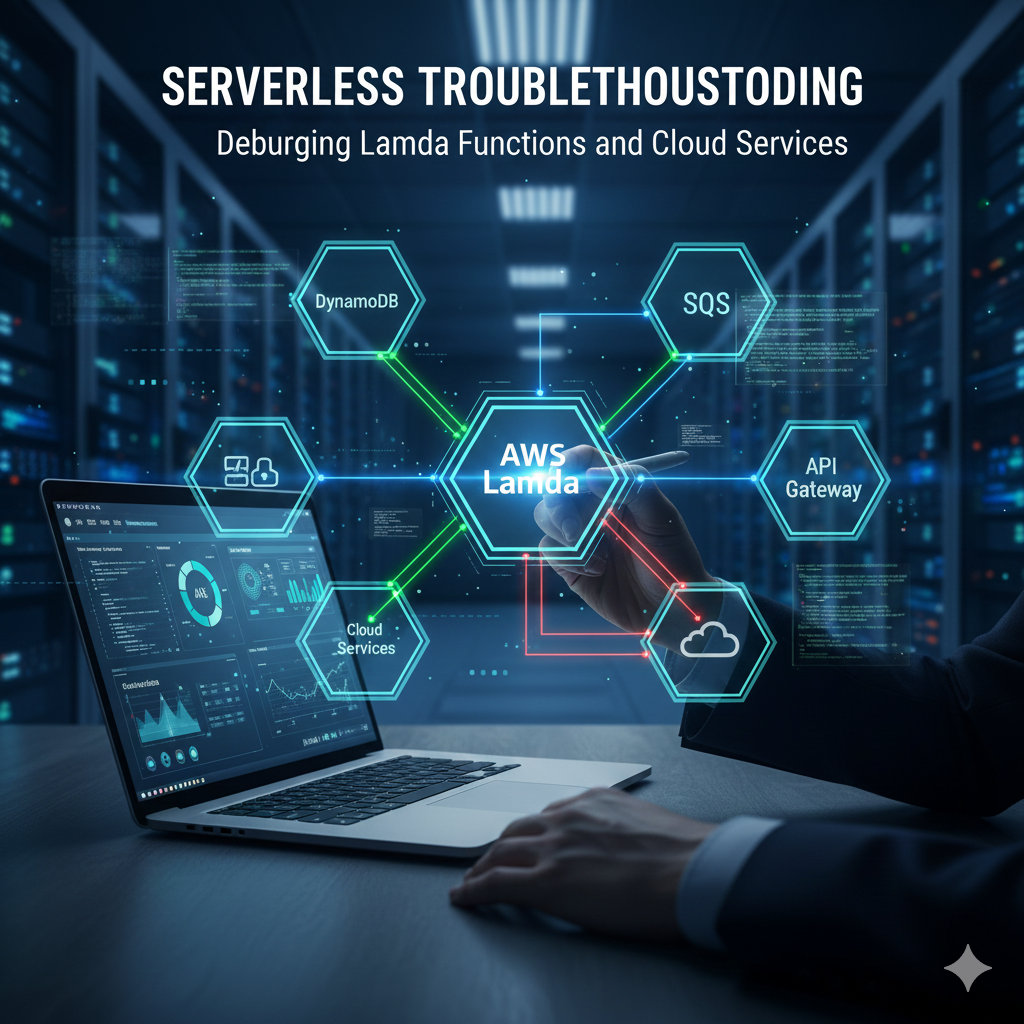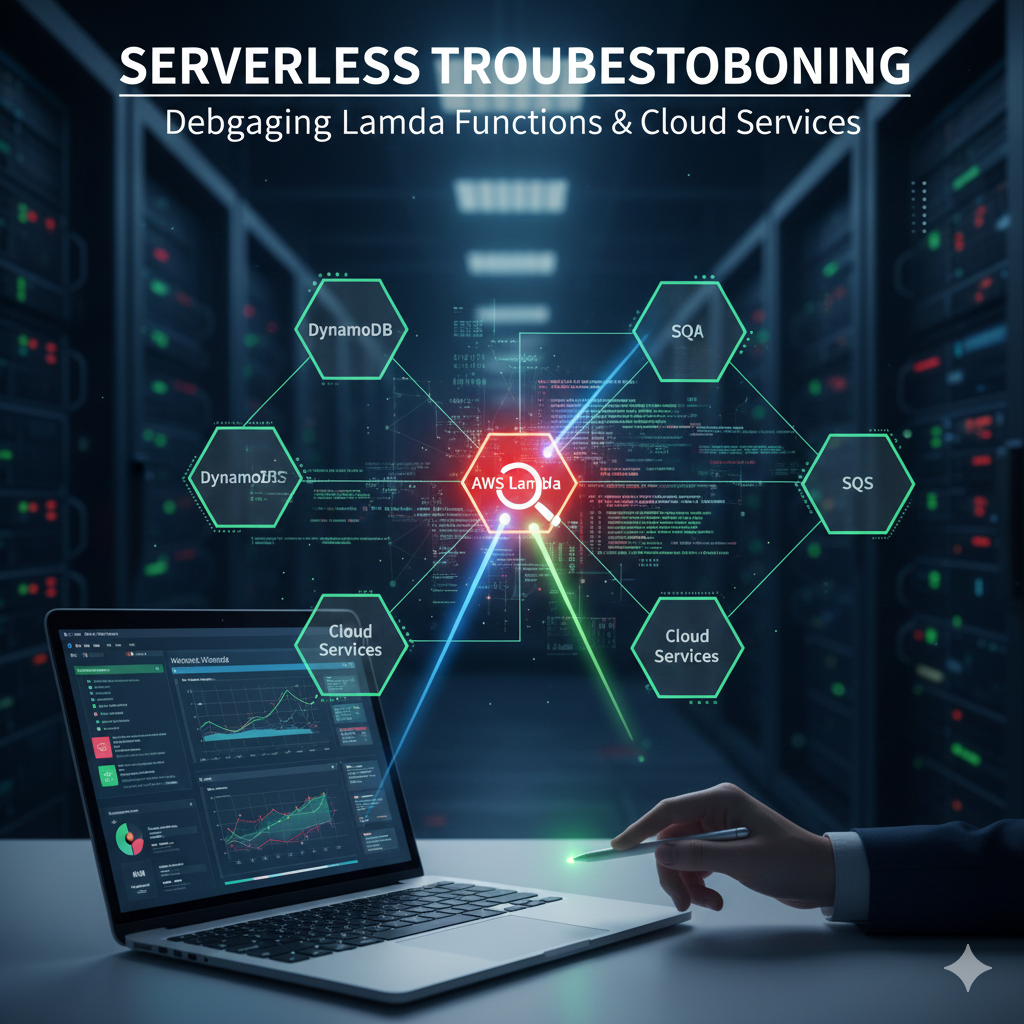
Serverless Troubleshooting: Debugging Lambda Functions and Cloud Services ⚡
The serverless paradigm, championed by services like AWS Lambda, offers an unparalleled promise. 🚀
It enables building and scaling applications rapidly without managing underlying infrastructure.
This shift allows developers to focus purely on business logic, accelerating time-to-market.
However, this convenience comes with a fundamental change in monitoring and debugging approaches.
Traditional methods like SSH-ing into servers are obsolete in ephemeral, stateless environments.
Effective serverless troubleshooting requires mastering cloud-native observability tools.
The complexity now lies in interconnected services forming the application architecture.
This guide explores essential tools for debugging AWS Lambda and cloud services effectively.
The Serverless Debugging Mindset Shift 🧠
Core challenges in serverless debugging stem from architectural characteristics.
Unlike monolithic applications, serverless functions are immutable and ephemeral.
Function instances are short-lived, created for single requests, then destroyed.
This makes traditional interactive debugging impossible in production environments.
Serverless applications are inherently distributed across multiple services.

A single request might trigger API Gateway, Lambda, DynamoDB, and external APIs.
An error at any point in this chain can cause entire transaction failure.
The solution is heavy reliance on Observability through Logs, Metrics, and Traces.
The Foundation: Amazon CloudWatch 📊
Amazon CloudWatch is the central nervous system for AWS monitoring.
It serves as the first line of defense for troubleshooting Lambda functions.
Every Lambda invocation automatically streams data to CloudWatch for analysis.
Centralized Logging with CloudWatch Logs 📝
CloudWatch Logs aggregates standard output and error streams from Lambda.
Developers must adopt structured logging in JSON format for effective troubleshooting.
Structured logs allow easy parsing and querying of raw text into searchable data.
Every log line should include the unique Request ID for specific invocation tracking.
This correlation key filters thousands of logs to exact sequences for failed requests.
For comprehensive monitoring strategies, see our guide on cloud monitoring best practices.
Metrics and Alarms with CloudWatch Metrics 🔔
CloudWatch automatically collects key metrics for every Lambda function.
These metrics provide high-level views of function health and performance.
Monitoring them is vital for identifying trends and setting proactive alerts.
| Metric Name | Description | Troubleshooting Use Case |
|---|---|---|
| Invocations | Number of function executions | Baseline for traffic and activity monitoring |
| Errors | Failed invocation count | Primary indicator of application failure rate |
| Duration | Function execution time | Identifying performance bottlenecks and latency |
| Throttles | Concurrency limit rejections | Indicates need for limit increases or optimization |
Analyzing Duration metrics helps spot performance issues and dependencies.
Comparing Errors to Invocations calculates true failure rates for alerting.
CloudWatch Log Insights for Deep Analysis 🔍
CloudWatch Log Insights enables powerful, SQL-like queries across log data.
Developers can query specific functions for errors with duration thresholds.
This provides targeted lists of problematic invocations for investigation.
https://youtu.be/9IYcG8zLtN0?si=Kj8m7nLpQwTzX9vR
Tracing the Distributed Path: AWS X-Ray 🗺️
AWS X-Ray provides distributed tracing for serverless applications.
It offers end-to-end views of requests across entire architecture paths.
While CloudWatch understands single functions, X-Ray provides cross-service context.
X-Ray Integration and Trace Maps 🗾
Enabling X-Ray on Lambda is often a simple configuration toggle.
It automatically instruments functions and tracks requests across services.
The resulting Trace Map visually represents application service graphs.
This visualization identifies guilty parties in multi-service transactions.
Learn more about implementing distributed tracing in microservices.
Analyzing Segments and Subsegments 📈
Traces comprise segments representing service work and subsegments for internal operations.
X-Ray effectively identifies external dependency latency within function execution.
If a function takes 1,000ms with 900ms waiting externally, the bottleneck is clear.
Annotations add custom business data like user IDs for trace filtering.
https://youtu.be/nC3kL3l5pOI?si=Wp3qLrTk8MzNvJ2f
Debugging Common Lambda Issues 🐛
Observability tools provide failure locations, but understanding causes is crucial.
Recognizing common serverless pitfalls helps developers address root causes.
Cold Starts Issues ❄️
Cold starts occur when Lambda execution environments need initialization.
This includes downloading code, setting up runtime, and running initialization code.
Initialization time adds significant latency to first requests.
Troubleshooting involves analyzing X-Ray Initialization segment duration.
Excessive cold starts indicate large deployment packages or inefficient code.
Provisioned Concurrency mitigates impact, but lean packages are best practice.
Configuration Errors ⚙️
Misconfiguration is a frequent source of serverless errors.
Issues often relate to resource allocation and execution environment settings.
| Configuration Setting | Symptom | Troubleshooting Step |
|---|---|---|
| Memory Allocation | High duration for CPU-bound tasks | Increase memory for proportional CPU power |
| Timeout | Abrupt termination with timeout error | Check logs and increase timeout setting |
| Environment Variables | KeyError or NameError in logs | Verify environment variable configuration |
| Handler Name | Immediate handler not found error | Ensure handler matches file and function name |
Permissions and IAM Issues 🔐
Permissions errors are common frustrations in serverless environments.
Lambda functions operate under Execution Roles defined in IAM.
They can only perform actions explicitly allowed by role policies.
Missing permissions result in AccessDenied errors for specific actions.
Troubleshooting involves checking CloudWatch logs for specific denial messages.
Solutions require updating function IAM Execution Role policies accordingly.
For security best practices, read our AWS IAM security guide.
Throttling Limitations 🚧
Throttling occurs when concurrent executions exceed configured limits.
Lambda rejects invocations with 429 Too Many Requests errors.
Monitoring CloudWatch Throttles metric identifies this issue.
Solutions include requesting service limit increases or optimizing execution.
https://youtu.be/9IYcG8zLtN0?si=G5h7bLmQvKdP8rT9
Advanced Debugging Techniques and Best Practices 🛠️
Advanced techniques significantly enhance serverless debugging workflows.
These approaches complement core observability tools for comprehensive solutions.
Local Simulation and Testing 💻
Reproducing bugs locally provides fastest resolution pathways.
AWS SAM CLI and Serverless Framework enable local Lambda execution.
Docker containers mimic AWS environments for accurate testing.
Traditional interactive debugging with breakpoints reduces feedback loops.
Comprehensive unit and integration tests catch failures before deployment.
Remote Debugging Capabilities 🌐
AWS enables remote debugging using IDEs like Visual Studio Code.
AWS Toolkit for VS Code attaches debuggers to cloud Lambda functions.
This technique diagnoses complex, environment-specific bugs effectively.
While unsuitable for high-traffic production, it’s invaluable for staging environments.
Defensive Coding and Error Handling 🛡️
Robust serverless applications employ defensive coding practices.
Comprehensive try…catch blocks handle expected failures gracefully.
Function responses should clearly indicate failure nature and causes.
Dead Letter Queues capture failed events for offline diagnosis.
This prevents event loss and enables payload inspection for root causes.
Logging Best Practices 📋
Log quality directly determines troubleshooting efficiency.
Follow these essential practices for optimal debugging results.
- Log Input Events: Record entire incoming event payloads after sanitizing sensitive data. 📨
- Log Dependencies: Track responses and status codes of external API calls. 🔗
- Use Log Levels: Implement DEBUG, INFO, WARN, ERROR levels for environment control. 🎚️
Structured logging transforms debugging from searching needles to data analysis.
https://youtu.be/nC3kL3l5pOI?si=B4nKj7fLpQmRzX8v
Conclusion: Mastering Serverless Observability 🏆
Serverless computing fundamentally changes the debugging contract.
It trades infrastructure complexity for distributed system observability.
Mastering CloudWatch and AWS X-Ray enables effective serverless navigation.
The shift from server location to trace analysis is key to robust applications.
Serverless environments are only opaque when observability tools are ignored.
Embrace cloud-native debugging to build high-performance serverless applications with confidence.
For more serverless insights, explore AWS Lambda documentation and our serverless architecture patterns.
