

Have you ever felt overwhelmed by the sheer volume of data your website generates?
Page views, bounce rates, conversion metrics – it can feel like drowning in a sea of numbers.
But what if I told you that within that data lies the key to unlocking your website’s full potential?
Website analytics isn’t just about reporting what happened;
it’s a powerful diagnostic tool that can help you uncover hidden problems, understand your visitors’ behavior, and ultimately, drive better results.
It’s about transforming raw data into actionable insights, turning confusion into clarity, and frustration into focused improvement.
I’m here to guide you through how to use this incredible resource to not just see the numbers, but to understand the story they tell about your website.
The Power of Website Analytics: Beyond the Surface
Videos are added as random thoughts 🤔 🤔…
At its core, website analytics is the process of collecting, measuring, analyzing, and reporting web data to understand and optimize web usage.
Tools like Google Analytics, Adobe Analytics, and many others, are designed to capture every interaction a user has with your site.
They track everything from where your visitors come from to what pages they view, how long they stay, and what actions they take.
But it’s not just about collecting data; it’s about interpreting it.
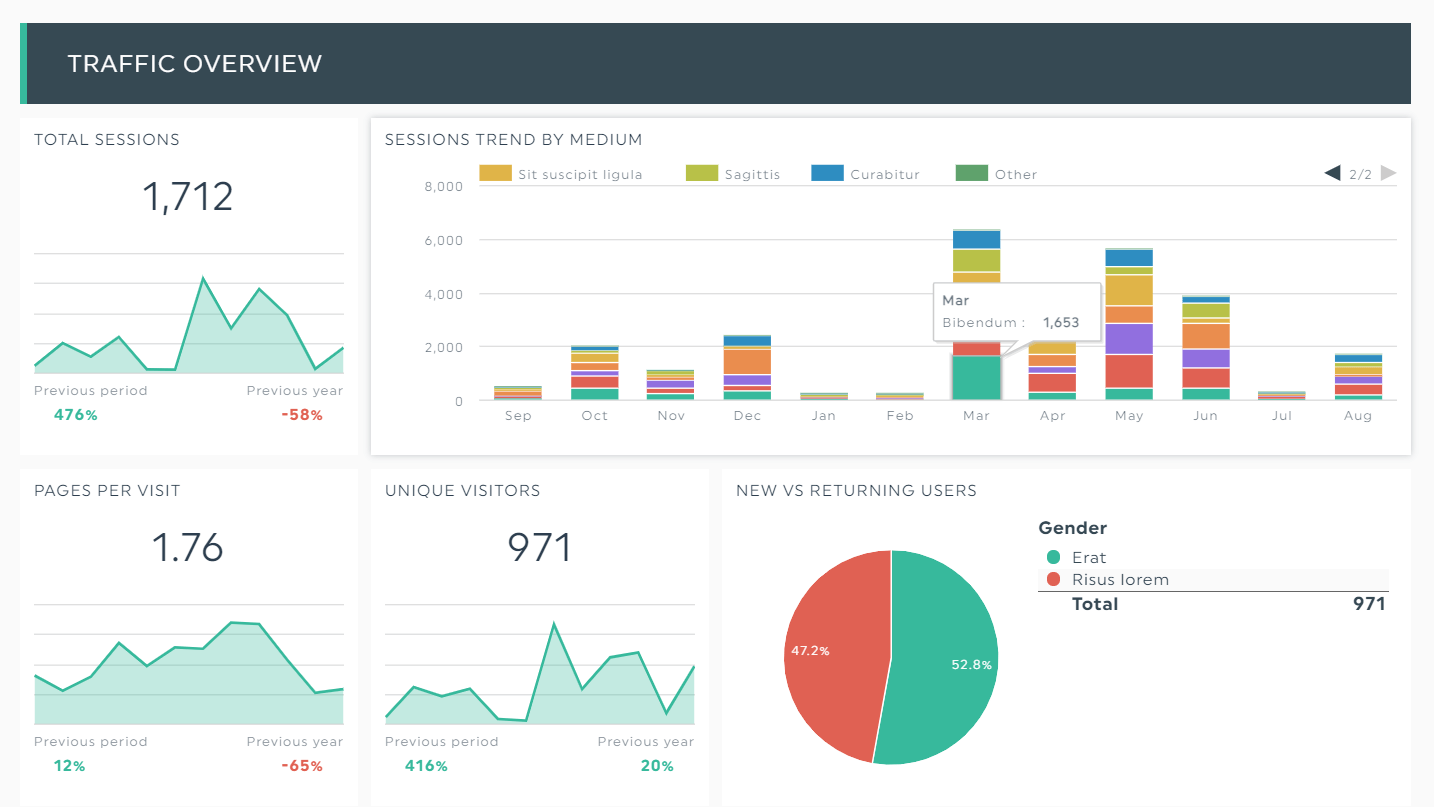
Here are some key metrics that, when understood correctly, can reveal a lot about your website’s health:
Traffic: This is the most basic metric, indicating the number of visitors to your site.
While a high number is generally good, it’s crucial to look at the *quality* of traffic.
Are these visitors relevant to your business? Are they engaging with your content?
Bounce Rate: This metric represents the percentage of visitors who leave your site after viewing only one page.
A high bounce rate can signal a problem with your content, user experience, or even how visitors are arriving at your site.
Conversion Rate: This is the percentage of visitors who complete a desired action on your site, such as making a purchase, filling out a form, or signing up for a newsletter.
This is often the most important metric for businesses, as it directly relates to revenue or lead generation.
Time on Page/Session Duration: These metrics indicate how long visitors spend on a particular page or on your site during a single visit.
Longer durations generally suggest more engagement and interest in your content.
These metrics, when viewed in isolation, might not tell the whole story.
However, when you start to see patterns or unexpected fluctuations, they become powerful indicators of underlying issues.
For example, a sudden drop in traffic might point to an SEO problem, while a consistent high bounce rate on a specific page could indicate that the content isn’t meeting user expectations.
Common Problems Hidden in Your Data (and How to Spot Them)
Now, let’s get to the heart of it: how to use these metrics to uncover the problems lurking within your website.
Analytics acts like a magnifying glass, helping you zoom in on areas that need attention.
High Bounce Rate
A high bounce rate is often the first red flag. While a certain level of bounce is normal (e.g., someone quickly finds the information they need and leaves), consistently high bounce rates across your site or on specific pages can indicate several issues:
Irrelevant Traffic: Are you attracting visitors who aren’t interested in your content? This could be due to misleading ad copy or SEO keywords.
Poor Content Quality: Is your content not engaging, not answering user questions, or difficult to read?
Slow Loading Times: Users are impatient. If your page takes too long to load, they’ll leave before they even see your content.
Bad User Experience (UX): Is your site difficult to navigate? Is the design confusing or unappealing? Are there too many pop-ups?
To investigate, look at the bounce rate by traffic source, by landing page, and by device. This can help you narrow down the cause.
Low Conversion Rate
If visitors are coming to your site but not completing desired actions, you have a conversion problem.
This is where you need to identify friction points in your user journey:
Confusing Forms: Are your forms too long, asking for unnecessary information, or difficult to submit?
Complex Checkout Process: Too many steps, unexpected shipping costs, or limited payment options can deter purchases.
Lack of Clear Call-to-Actions (CTAs): Do users know what you want them to do next? Are your CTAs prominent and compelling?
Trust Issues: Is your site secure? Do you have testimonials or trust badges?
Analyze your conversion funnels to see where users are dropping off. This will pinpoint the exact step where you’re losing potential customers.
Decreased Traffic
A drop in overall website traffic can be alarming. It could be due to:
SEO Issues: Have your search engine rankings dropped? This could be due to algorithm changes, technical SEO problems, or new competitors.
Broken Links: Are there internal or external links on your site that are no longer working, leading to a poor user experience and hurting your SEO?
Content Decay: Is your content outdated or no longer relevant? Fresh, updated content tends to perform better.
Seasonal Trends: Is the drop in traffic part of a normal seasonal fluctuation for your industry?
Check your traffic sources to see which channels are underperforming. Look at your organic search traffic, referral traffic, and direct traffic.
Short Time on Page/Session Duration
If users are spending very little time on your pages or your site, it suggests they’re not finding what they’re looking for or aren’t engaged:
Irrelevant Content: Is the content on the page not matching the user’s intent or the title/description they clicked on?
Poor Readability: Is the text too dense, lacking headings, or difficult to scan?
Lack of Interactivity: Are there opportunities to engage users with videos, images, or interactive elements?
Look at specific pages with low time on page and consider if the content is truly valuable and well-presented.
High Exit Rates on Key Pages
While a high exit rate on a thank you page is expected, a high exit rate on a crucial landing page or a step in your conversion funnel is a major concern.
This indicates users are abandoning their journey at that specific point.
Technical Errors: Are there broken forms, JavaScript errors, or other technical glitches preventing users from proceeding?
Frustrating Design: Is the layout confusing? Are buttons hard to find or click? Is the page responsive on all devices?
Information Overload: Is there too much information presented at once, overwhelming the user?
Unexpected Requirements: Are users being asked for information they weren’t prepared to give, or encountering unexpected costs?
Use analytics to identify these high exit pages and then conduct a thorough review of their content, design, and functionality.
Mobile vs. Desktop Discrepancies
In today’s mobile-first world, it’s crucial that your website performs well on all devices.
If you see significant differences in metrics like bounce rate, time on page, or conversion rate between mobile and desktop users, it points to a problem with your mobile experience.
Poor Responsive Design: Does your website adapt well to smaller screens? Are elements overlapping or difficult to read?
Slow Mobile Loading: Mobile networks can be slower, so optimizing for mobile speed is critical.
Difficult Mobile Navigation: Is your menu easy to use on a touchscreen? Are touch targets large enough?
Regularly check your analytics for device-specific performance and use mobile-friendly testing tools to identify issues.
Diving Deeper: Troubleshooting with Analytics
Once you’ve identified potential problem areas, it’s time to dig deeper.
Website analytics tools offer advanced features that can help you pinpoint the root cause of issues and gain a more nuanced understanding of user behavior.
Segmenting Your Data
One of the most powerful features of analytics is the ability to segment your data.
Instead of looking at overall averages, you can filter your data to understand specific groups of users. For example, you can segment by:
New vs. Returning Users: Do new visitors behave differently than returning ones?
A high bounce rate for new users might indicate a problem with your initial impression.
Traffic Sources: Do users coming from social media behave differently than those from organic search? This can help you optimize your marketing channels.
Geographic Location: Are there performance issues in certain regions? This could point to server latency or content relevance issues.
Device Type: As mentioned, comparing mobile, tablet, and desktop user behavior is crucial for identifying responsiveness issues.
By segmenting, you can isolate problems and tailor your solutions to specific user groups.
Funnel Analysis
For websites with specific user journeys (e.g., e-commerce sites with a checkout process, lead generation sites with a form submission process), funnel analysis is indispensable. A funnel visualizes the steps a user takes to complete a goal.
By setting up funnels in your analytics tool, you can see exactly where users are dropping off.
For instance, if you have a 5-step checkout process, and 80% of users abandon at step 3, you know exactly where to focus your optimization efforts.
This helps you identify bottlenecks and friction points that prevent users from converting.
Heatmaps and Session Recordings
While traditional analytics tells you what happened, tools that provide heatmaps and session recordings show you *how* users interact with your site.

Heatmaps visually represent where users click, move their mouse, and scroll on a page. This can reveal:
Unclicked CTAs: Users aren’t seeing or clicking your calls to action.
Confusing Layouts: Users are clicking on non-clickable elements, indicating confusion.
Content Engagement: Users are scrolling past important content or not engaging with certain sections.
Session recordings, on the other hand, are like watching a video of a user’s entire journey on your site.
You can see their mouse movements, clicks, scrolls, and even form submissions.
This qualitative data is invaluable for understanding user frustrations and identifying usability issues that numbers alone can’t reveal.
A/B Testing
Once you’ve identified a problem and formed a hypothesis about how to fix it, A/B testing (or split testing) allows you to test your proposed solution against the original version.
You show different versions of a page or element to different segments of your audience and measure which version performs better.
This data-driven approach ensures that your changes are actually improving your website’s performance, rather than just being based on assumptions.
It’s a continuous cycle of hypothesize, test, analyze, and optimize.
Setting Up Custom Alerts
Don’t wait for a major problem to hit before you notice it.
Most analytics platforms allow you to set up custom alerts.
These alerts can notify you via email or other channels if a specific metric deviates significantly from its normal range.
For example, you can set an alert for:
A sudden drop in traffic.
A spike in bounce rate on a key landing page.
A significant decrease in conversion rate.
Proactive monitoring allows you to address issues quickly, minimizing their impact on your website’s performance.
Actionable Insights: Turning Data into Solutions
Collecting data and identifying problems is only half the battle.
The real power of website analytics lies in its ability to help you turn those insights into tangible improvements.
This is where the iterative process of optimization comes into play.
First, prioritize problems based on impact.
Not all problems are created equal.
A high bounce rate on a rarely visited blog post might not be as critical as a small drop in conversion rate on your main product page.
Focus your efforts on issues that have the greatest potential to improve your business goals.
Use a framework like PIE (Potential, Importance, Ease) or ICE (Impact, Confidence, Ease) to help you prioritize.
Next, develop hypotheses for solutions.
Based on your data analysis, what do you think is causing the problem, and what specific change do you believe will fix it?
For example, if you have a high exit rate on a checkout page, your hypothesis might be:
“Adding more payment options will reduce the exit rate on the checkout page by 5%.”
This structured approach helps you stay focused and makes it easier to measure the success of your changes.
Then, implement changes and monitor results.
This is where A/B testing (as discussed earlier) becomes crucial.
Implement your proposed solution and closely monitor the relevant metrics.
Did the change have the desired effect? Did it inadvertently cause other problems?
It’s important to give changes enough time to gather meaningful data before drawing conclusions.
Finally, remember that optimization is an iterative process.
The internet is constantly evolving, user behavior changes, and your website is a living entity.
There’s no single “fix it and forget it” solution.
Continuously monitor your analytics, identify new problems, test new solutions, and refine your website.
This ongoing cycle of analysis, hypothesis, testing, and learning is what drives sustained growth and improvement.
Conclusion
Website analytics, at first glance, might seem like a daunting collection of numbers and charts.
However, as we’ve explored, it’s far more than just a reporting tool.
It’s a powerful diagnostic instrument, a compass that points you towards areas of improvement, and a mirror reflecting your users’ true experiences on your site.
By understanding key metrics, recognizing common problems, and diving deeper with segmentation, funnel analysis, heatmaps, and A/B testing,
you transform from a passive observer into an active optimizer.
You gain the ability to not just see that something is wrong, but to understand why, and more importantly, how to fix it.
So, the next time you log into your analytics dashboard, don’t just look at the surface.
- Dig deeper.
- Ask questions.
Let the data tell you its story. Empower yourself to find those hidden problems and turn them into opportunities for growth.
Your website, and your users, will thank you for it.
What are your biggest challenges when it comes to website analytics? What hidden problems have you uncovered in your data? Share your experiences and insights in the comments below – let’s learn from each other!
https://www.youtube.com/watch?v=u_ECkoHVlZ8)