







When it comes to how to trace frozen application main thread using Sysinternals Process Monitor, getting the right details matters. Samsung T9 Portable SSD
SanDisk Professional PRO-G40 SSD
Elgato Stream Deck MK.2
How to Trace a Frozen Application Main Thread Using Sysinternals Process Monitor: A Field Blueprint for Diagnosing Windows UI Hangs
The Technical Reality — Why the Main Thread Freezes
Main-Thread Message-Pump Blockage and the 5-Second “Not Responding” Threshold
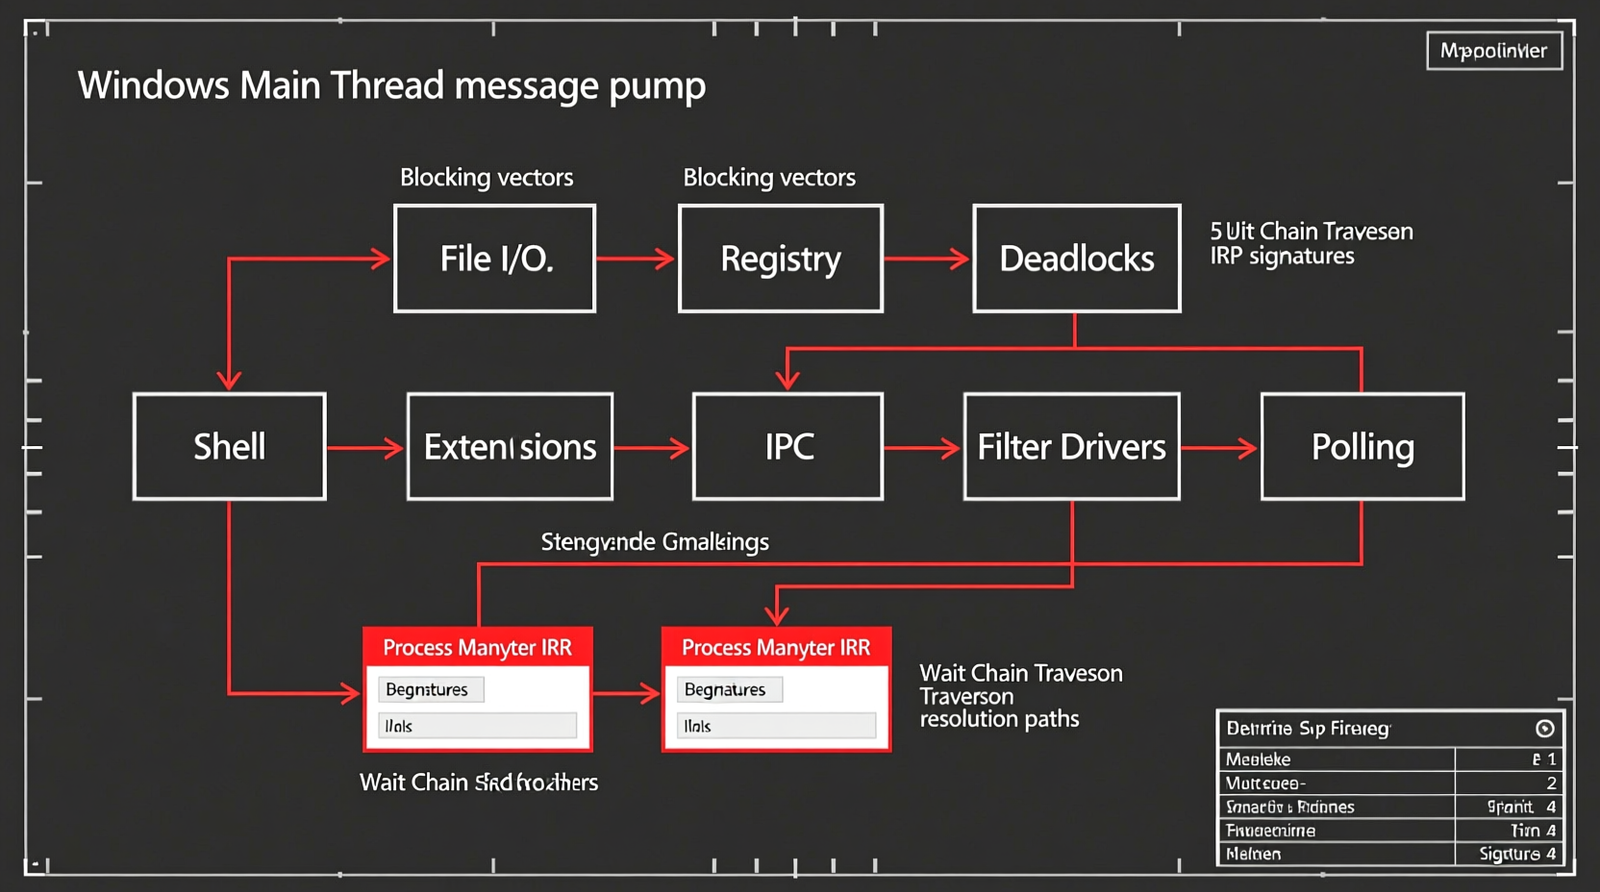
A Windows GUI application relies on a single main/UI thread responsible for pumping the message loop, handling drawing operations, and processing input events.
When this thread blocks on a synchronous operation, the interface freezes, and Windows flags the window as “Not Responding” after approximately 5 seconds of message-queue inactivity.
In most diagnostic tools, this thread appears as the first thread created, often reported as TID 0, though thread IDs are not guaranteed to be zero.
The first thread is almost always the UI thread, making it the critical target for rescue and analysis during hang diagnostics.
The Seven Blocking Sources That Park the UI Thread
1. Synchronous file I/O on slow or unreachable paths, including mapped network drives, UNC paths, offline cloud storage, and removable media.
2. Synchronous registry queries against remote or heavily loaded hives that delay thread execution.
3. Deadlocked critical sections, mutexes, or semaphores inside the process or across process boundaries.
4. Inter-process communication waits involving DDE, COM, RPC, or named pipes.
5. Shell extension DLLs loaded into the process performing blocking operations.
6. Kernel-mode filter drivers, such as antivirus, backup, endpoint detection, or encryption agents, intercepting and delaying IRPs.
7. Rapid background polling loops often mistaken for the root cause of the hang.
The Procmon Diagnostic Signature of a Hung Main Thread
Process Monitor exposes a hung main thread through a repeating or stuck operation on the same thread ID, revealing the exact point of blockage.
Watch for these file-system operations in the trace: IRP_MJ_CREATE, IRP_MJ_QUERY_INFORMATION, IRP_MJ_READ, IRP_MJ_WRITE, IRP_MJ_CLOSE, IRP_MJ_SET_INFORMATION, and FASTIO_* calls.
Simultaneously monitor these registry operations: RegOpenKey, RegQueryValue, RegQueryKey, RegSetValue, and RegCloseKey.
The result column displays SUCCESS or PENDING states with no subsequent completion events, or reveals a rapid loop of identical operations making zero progress.
This pattern constitutes the definitive diagnostic signature of a parked main thread, indicating the process is trapped in a blocking call.
Process Monitor captures comprehensive file system, registry, process, and thread activity, including optional stack traces that map the execution flow.
This capability reveals the precise API call and driver frame where the main thread is parked, providing the exact root cause that other tools miss.
The Core Gear Architecture — 2026 Validated Diagnostic Stack
Primary Diagnostic Storage — Samsung T9 Portable SSD
| Specification | Detail |
|---|---|
| Interface | USB 3.2 Gen 2×2 (20 Gbps) |
| Sequential Read | Up to 2,000 MB/s |
| Sequential Write | Up to 2,000 MB/s |
| Capacities | Up to 4 TB |
Process Monitor logs can expand by multiple gigabytes per minute on active systems, requiring storage with high sustained write throughput to prevent data loss.
Legacy USB 3.0 flash drives fail under this load, resulting in dropped capture frames and corrupted logs that compromise diagnostic accuracy.
The Samsung T9 Portable SSD maintains trace integrity via its USB 3.2 Gen 2×2 interface and 2,000 MB/s sequential write speed, ensuring high-frequency capture never chokes the pipeline.
High-Throughput Workstation Drive — SanDisk Professional PRO-G40 SSD
| Specification | Detail |
|---|---|
| Interface | Thunderbolt 3 / USB 3.2 Gen 2 |
| Sequential Read | Up to 3,000 MB/s |
| Sequential Write | Up to 2,500 MB/s |
The SanDisk Professional PRO-G40 SSD delivers Thunderbolt 3 and USB 3.2 Gen 2 connectivity with 3,000 MB/s read speeds and 2,500 MB/s write speeds for rapid data access.
This throughput eliminates storage bottlenecks when opening multi-gigabyte Procmon traces, symbol caches, and memory dumps, ensuring offline analysis remains fluid and responsive.
Physical Control Surface — Elgato Stream Deck MK.2
| Specification | Detail |
|---|---|
| Keys | 15 Customizable LCD Keys (72 × 72 px per key) |
| Interface | USB 2.0 |
| Integration | HWiNFO Plugin for Real-Time CPU / Memory / Thread Monitoring |
| One-Touch Actions | Launch procmon.exe, Launch procexp.exe, Force-Kill Hung Processes by PID |
The Elgato Stream Deck MK.2 functions as a precision physical control surface, enabling one-touch execution of Procmon, Process Explorer, and process termination commands without diverting focus from the target window.
This setup reduces cognitive load and interaction latency during diagnostics, while the 15 customizable LCD keys provide real-time CPU, memory, and thread load visualization via the HWiNFO plugin for immediate system state awareness.
The Technical Setup Blueprint — From Capture to Root Cause
Recommended Insights From Our Guide Library:
Pre-Flight Procmon Configuration: Filters, Stack Traces, and Symbols
Configure Process Monitor filters to capture only the target process name before initiating the trace to limit data volume and focus the analysis.
Skipping filters results in multi-gigabyte-per-minute capture bloat, overwhelming storage and making trace analysis impossible, a common pitfall documented in community support forums.
Enable stack tracing in Process Monitor options and ensure `DbgHelp.dll` and `SymSrv.dll` are present, then configure the symbol path to the Microsoft public server: `SRV*C:\Symbols*http://msdl.microsoft.com/download/symbols`.
This configuration is mandatory for resolving stack frames; without it, traces contain only hexadecimal offsets that provide no actionable diagnostic data.
Main Thread Identification and Wait-State Confirmation
Navigate to the Threads tab in Process Explorer for the target process and identify the thread consuming zero CPU while in a wait state, which typically indicates the blocked main/UI thread.
Cross-reference this thread ID with the stuck operation in Process Monitor to confirm the correlation and pinpoint the exact blocking call.
Wait Chain Traversal and Cross-Process Dependency Mapping
Utilize the Wait Chain Traversal (WCT) API via `wctapi.h` and the `WctEnumerateProcesses` function to map hidden dependencies and cross-process blocking chains.
WCT reveals external causes such as COM server waits, locked files, or dependent services, preventing misdiagnosis where the application is blamed for a hang induced by an unrelated system component.
Capture-to-NVMe Pipeline and Thermal Management
| Requirement | Baseline Specification |
|---|---|
| Interface | USB 3.2 Gen 2×2 (20 Gbps) or Thunderbolt 3/4 |
| Controller | NVMe PCIe-Based SSD (No Legacy NAND Flash) |
| Throughput Target | Minimum 1,500 MB/s Sustained Write |
| Thermal Design | Aluminum Heatsink Casing Required |
Inexpensive USB 3.0 flash drives suffer thermal throttling during sustained writes, leading to dropped capture frames and log corruption that render traces unreliable.
This failure mode wastes billable hours on incomplete diagnostics, a risk eliminated by the high-performance architecture of the Samsung T9 Portable SSD and SanDisk Professional PRO-G40 SSD.
The Seven-Step Diagnostic Workflow
1. Pre-configure Procmon filters to capture only the target process name.
2. Enable stack tracing and configure the symbol path.
3. Reproduce the hang.
4. Stop capture and inspect the last operations on the main thread.
5. Look for repeated operations, pending IRPs, or network/registry paths.
Check out TECH Collection Amazon Products
6. Use Process Explorer Wait Chain or WCT to identify cross-process blocks.
7. Export the trace to the portable NVMe diagnostic drive for offline analysis.
Field Verdict & Operational ROI — Why the Right Gear Pays for Itself
Why Cheap USB 3.0 Flash Drives Fail Under Sustained Procmon Writes
Inexpensive USB 3.0 flash drives suffer thermal throttling during sustained writes, leading to dropped capture frames and log corruption that render traces unreliable.
This failure mode wastes billable hours on incomplete diagnostics, a risk eliminated by the high-performance architecture of the Samsung T9 Portable SSD and SanDisk Professional PRO-G40 SSD.
The Cost of Misdiagnosis — Forum-Tested Pain Points
- Log Bloat: Multi-gigabyte-per-minute captures occur when filtering is skipped, overwhelming storage and analysis tools.
- Symbol Confusion: Technicians stall because the symbol server path is wrong or missing, leaving stack traces unreadable.
- False Positives: Repeated registry reads or background polling are mistaken for the hang cause, diverting investigation efforts.
- Cross-Process Dependencies: Hangs caused by shell extensions, antivirus filter drivers, or dependent services remain hidden without Wait Chain Traversal.
The Portable Diagnostic Kit as a Revenue-Protecting Investment
The combination of the Samsung T9 Portable SSD, SanDisk Professional PRO-G40 SSD, and Elgato Stream Deck MK.2 creates a mobile, high-fidelity diagnostic workstation designed for field reliability.
This stack reduces mean-time-to-resolution by eliminating storage bottlenecks and false leads, preventing expensive misdiagnoses while positioning you as the definitive expert for root-cause analysis of UI hangs.
Conclusion
This blueprint provides the complete methodology for tracing frozen application main threads using Sysinternals Process Monitor, covering the 5-second threshold, seven blocking sources, and diagnostic signatures.
Mastery of filters, symbols, stack traces, Process Explorer thread confirmation, and Wait Chain Traversal enables precise identification of cross-process dependencies and rapid resolution of UI hangs.
The Samsung T9 Portable SSD prevents capture pipeline choking, the SanDisk Professional PRO-G40 SSD manages heavy offline analysis, and the Elgato Stream Deck MK.2 delivers one-touch diagnostic control.
Community Reference & Authority Resources:
These components form a unified portable diagnostic workstation that safeguards your time, reputation, and revenue by ensuring reliable, high-speed trace capture and analysis.
Stop guessing why applications freeze. Capture the evidence, read the stack, and fix the root cause.
🔍 Explore More: See all tech guides and tutorials for how to trace frozen application main thread using Sysinternals Process Monitor.
Check out TECH Collection Amazon Products