

Have you ever felt that nagging frustration when a system goes down, or a communication channel falters, and you’re left scrambling for answers?
It’s a common scenario, and often, the solution lies much closer than you think.
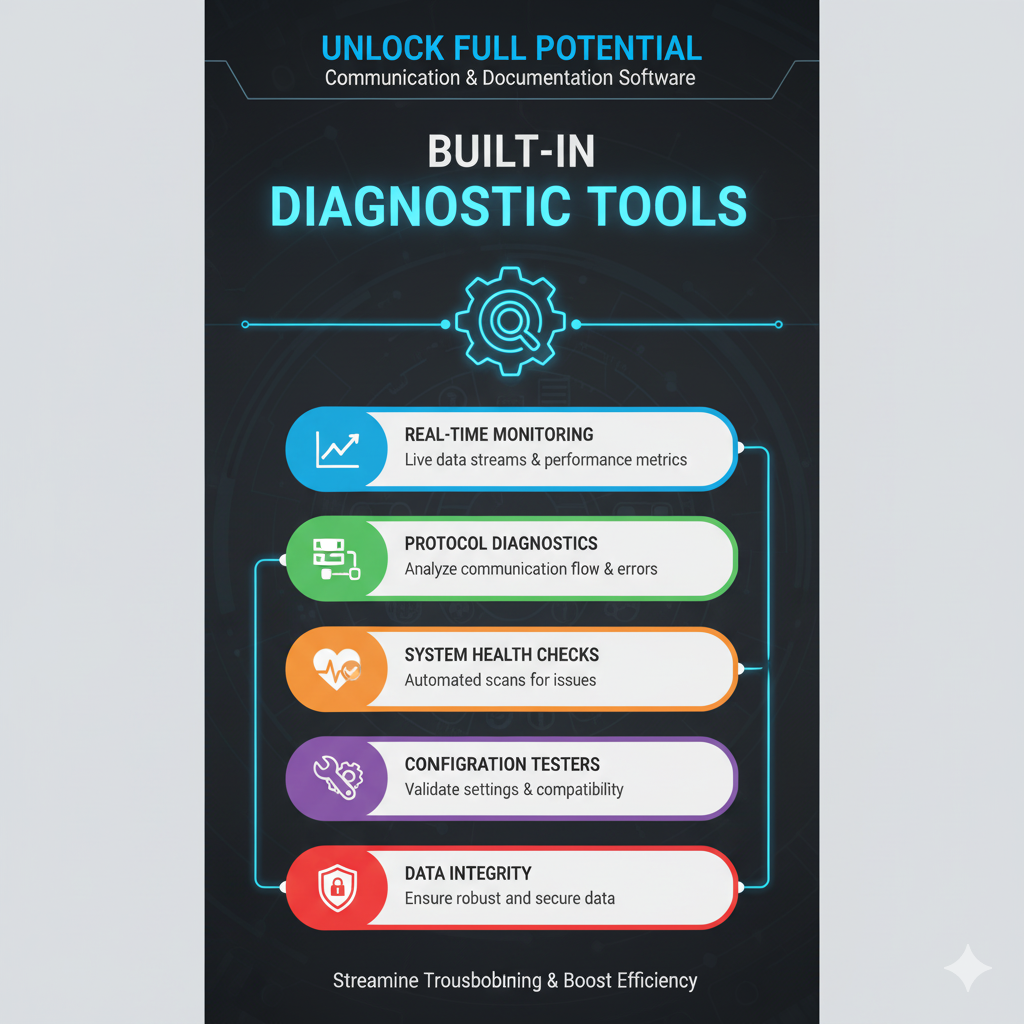
The truth is, many of our essential communication and documentation tools come equipped with powerful, built-in diagnostic features designed to prevent these headaches.
Yet, these silent heroes often go unnoticed, their capabilities underutilized.
I remember a time when a critical data feed unexpectedly stopped flowing.
Panic set in as deadlines loomed. After hours of frantic searching, a colleague casually pointed me towards a built-in protocol diagnostic tool I didn’t even know existed within our industrial communication server.
Within minutes, it pinpointed the exact packet loss, saving us from a potential disaster.
This experience taught me a valuable lesson: understanding and leveraging these integrated diagnostic tools isn’t just about troubleshooting;
it’s about proactive problem-solving and ensuring operational resilience.
This post will explore various built-in diagnostic tools across communication and documentation software,
highlighting their importance and how you can leverage them for improved efficiency and reliability.
The Unsung Heroes: Diagnostic Tools in Communication Software
Communication software, from industrial control systems to unified communication platforms, relies heavily on seamless data flow.
When this flow is interrupted, the impact can be significant. Fortunately, many of these systems offer sophisticated diagnostic capabilities that can turn a crisis into a minor hiccup.
Industrial Communication: The Case of TOP Server
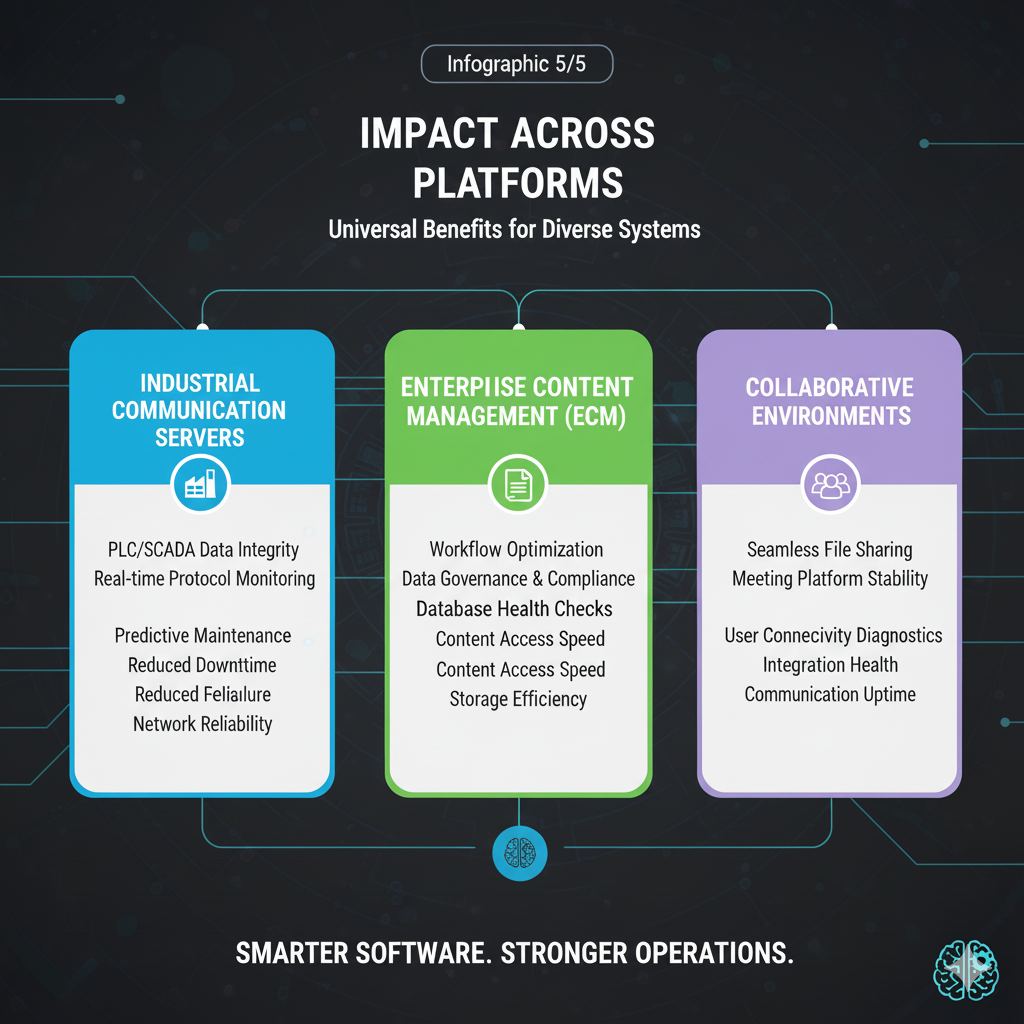
Industrial communication servers, likeTOP Server, are the backbone of many operational technologies, connecting diverse devices and applications.
They come packed with features designed to ensure robust data exchange and simplify troubleshooting [1].
One such feature is the OPC Quick Client.
This tool, included with all TOP Server licenses, allows users to test communications to their devices in real-time.
If you can see data flowing through the OPC Quick Client, you immediately know that the TOP Server is successfully communicating with your device.
This significantly narrows down the scope of troubleshooting, making it easier to identify issues originating at the HMI/SCADA/MES/Historian level rather than the communication layer itself.
Beyond basic connectivity, Communications Protocol Diagnostics offer a deeper dive.
Available at both channel and device levels, these diagnostics capture send and receive data, complete with precise timestamps.
This granular detail is invaluable for pinpointing the exact moment and nature of communication failures, allowing for targeted solutions.
Furthermore, the Event Log provides detailed messages whenever an issue arises.
These logs, coupled with comprehensive Help files, explain settings, addressing syntax, and the meanings of various error codes, guiding users directly to the root cause of problems.
For issues related to client application connectivity, Built-in OPC Diagnostics are a lifesaver.
They help address problems with OPC client applications connecting to the TOP Server and offer flexible OPC interoperability options to overcome common compatibility challenges.
The inclusion of Simulation Abilities and System/Statistics Tags further enhances troubleshooting and connectivity management,
allowing for testing scenarios and monitoring system health without impacting live operations [1].
Unified Communications & Collaboration: CoreDial and Cisco Prime Collaboration
In the realm of unified communications, platforms like CoreDial’s sipXecs systems and Cisco Prime Collaboration provide a suite of diagnostic tools essential for maintaining voice and video network health [2, 3].
CoreDial’s systems, for instance, feature a Registrations Screen that allows administrators to monitor currently registered endpoints, such as phones and terminal adaptors.
This screen is crucial for understanding call routing and assessing load balancing in High Availability (HA) clusters.
It helps ensure that calls are distributed efficiently and that all devices are properly connected.
The Job Status Window provides verification for the successful creation of configuration profiles for phones or gateways, offering limited error messages if any issues occur during this process.
Managing the operational state of services is made easier with the Services Screen.
This interface displays the current status of all system services and allows for selective stopping or restarting of individual components.
This functionality is particularly vital when applying configuration changes, as many updates require a service restart to take effect.
For more in-depth investigations, the Snapshot tool captures the entire system’s state, providing a comprehensive dataset that can be sent to technicians or developers for detailed analysis of complex issues.
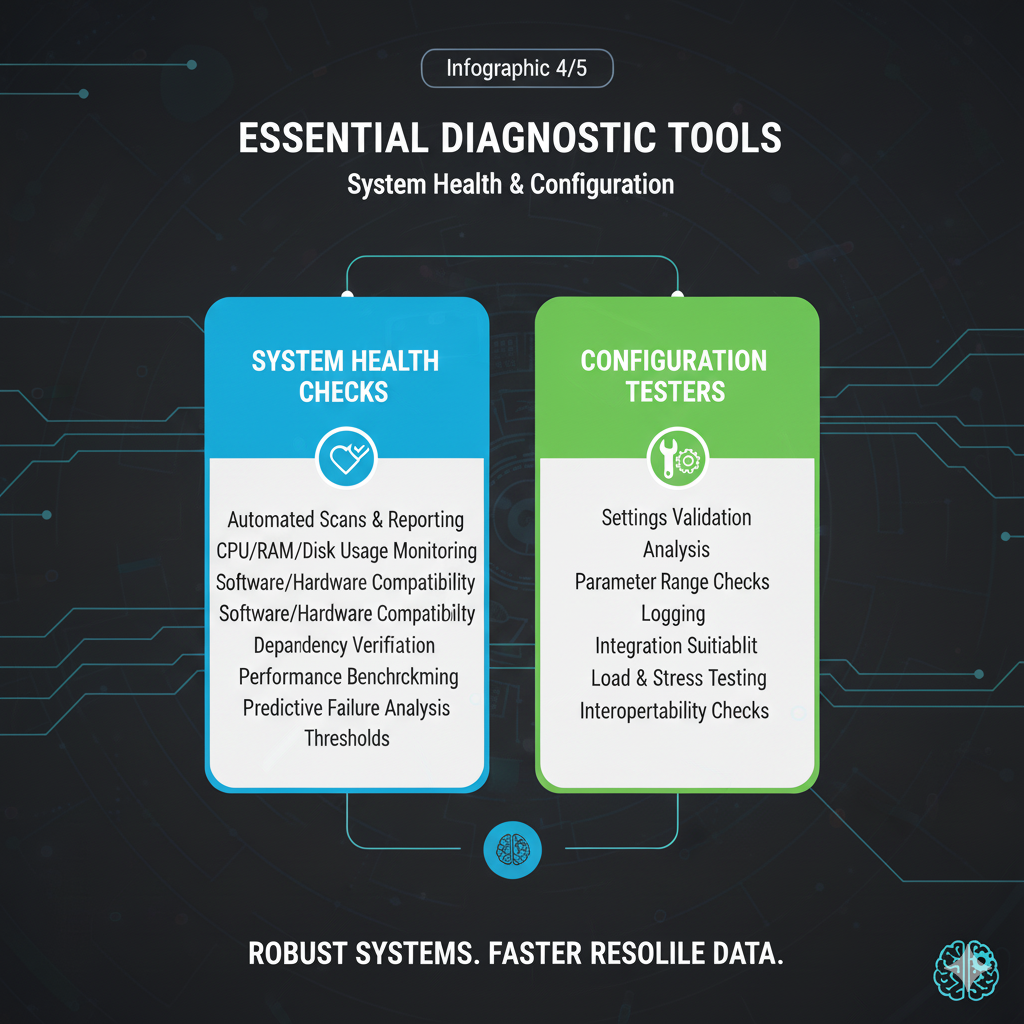
To ensure foundational stability, Configuration Tests are available to verify that primary components are correctly configured and functioning as intended.
It is highly recommended to run these tests on all new systems as a preliminary step before full configuration.
Additionally, the DNS Advisor Tool specifically tests the system’s DNS settings, confirming correct connectivity and configuration of DNS resources.
This tool provides extensive details, which are invaluable for troubleshooting DNS-related problems that can often be elusive [2].
Cisco Prime Collaboration offers Advanced Diagnostics that include traffic simulation and the ability to test circuits and endpoints.
These capabilities are critical for identifying core issues within complex voice and video networks, ensuring consistent and reliable service delivery [3].
Illuminating Documentation & Content Management Systems
Documentation and Content Management Systems (CMS) are central to knowledge sharing and content delivery.
While often perceived as static, these platforms also benefit immensely from built-in diagnostic tools that ensure performance, security, and content integrity.
CMS Health & Performance: WordPress, Drupal, and Confluence
Popular CMS platforms like WordPress, Drupal, and Confluence incorporate various diagnostic features to help maintain their health and performance.
WordPress, for example, includes a Site Health tool that provides an overview of your site’s configuration and highlights critical issues that need attention.
It checks for common performance and security problems, such as outdated PHP versions, missing modules, or inactive plugins/themes.
Beyond this, many plugins offer debugging capabilities and tools for database optimization, allowing users to fine-tune their site’s performance and troubleshoot specific issues.
Drupal provides a comprehensive Status Report that summarizes the system’s health, including warnings and errors related to modules, PHP configuration, and database issues.
Its robust logging and error reporting mechanisms are invaluable for developers.
Furthermore, command-line tools like Drush offer powerful diagnostic commands for cache rebuilding, database updates, and module management, making it easier to diagnose and resolve complex problems [4].
Confluence, a widely used collaboration and documentation platform, offers several diagnostic capabilities.
Its System Information section provides detailed insights into the application’s environment, including memory usage, database connections, and installed plugins.
For Data Center products, In-Product Diagnostics (IPD) continuously checks for symptoms or behaviors that could lead to problems, helping to proactively identify and address potential issues.
Thread Diagnostics, often part of the Atlassian Troubleshooting and Support tools app, helps analyze performance bottlenecks by examining active threads within the application [5].
Across various CMS platforms, general diagnostic tools often include database integrity checkers to ensure data consistency, caching diagnostics to optimize content delivery speed, and broken link checkers to maintain content quality.
Many also integrate or support SEO analysis tools that can identify issues impacting search engine visibility, such as missing meta descriptions or slow page load times.
Version Control & Collaboration Documentation
For platforms centered around version control and collaborative documentation, diagnostic tools focus on code integrity, deployment health, and API performance.
In environments like GitLab and GitHub, CI/CD pipeline logs are crucial diagnostic assets.
They provide detailed output of every step in the continuous integration and deployment process, helping developers pinpoint failures in builds, tests, or deployments.
Repository health checks and dependency scanning tools identify vulnerabilities and outdated libraries,
while security alerts notify teams of potential threats within their codebase.
These tools are vital for maintaining secure and stable development workflows.
Platforms like ReadMe.io, designed for API documentation, often include API metrics and uptime monitoring.
These features allow developers to track the performance and availability of their APIs, ensuring that documentation accurately reflects the live service.
Version history for documentation itself acts as a diagnostic tool, allowing teams to revert to previous states if errors are introduced or to understand changes over time.
Why These Tools Matter
The importance of these built-in diagnostic tools cannot be overstated.
They are not just nice-to-haves; they are fundamental to maintaining efficient, reliable, and secure operations.
Proactive Problem Solving: These tools enable you to identify potential issues before they escalate into critical failures.
By regularly monitoring system health and reviewing diagnostic reports, administrators can address minor anomalies before they impact users or business operations.
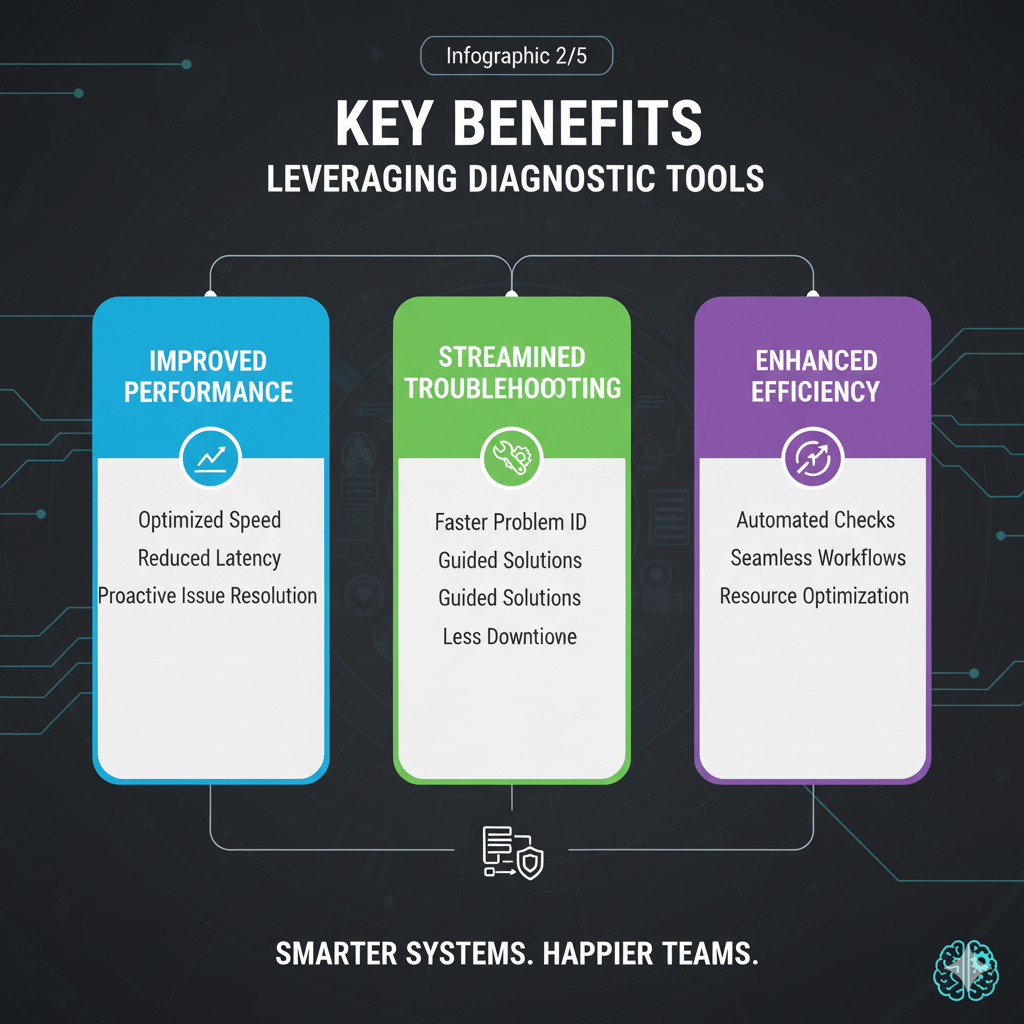
Reduced Downtime: When problems do occur, built-in diagnostics drastically cut down the time it takes to diagnose and resolve them.
Instead of guessing, you have concrete data and insights, leading to faster recovery and minimal disruption.
Optimized Performance: By providing insights into system bottlenecks, resource utilization, and configuration errors, diagnostic tools help optimize the performance of your communication and documentation platforms.
This ensures that systems run smoothly, respond quickly, and handle workloads efficiently.
Enhanced Security: Many diagnostic features include security checks, vulnerability scanning, and monitoring for suspicious activities.
Leveraging these tools helps protect your systems and data from cyber threats and ensures compliance with security policies.
Empowering Users: These tools empower administrators and power users with greater control and insight into their systems.
They democratize troubleshooting, allowing teams to resolve many issues independently, reducing reliance on external support.
Tips for Maximizing Your Diagnostic Tools
Simply having these tools isn’t enough; you need a strategy to make the most of them.
Here are some tips to maximize their value:
Regular Audits: Don’t wait for a problem to arise. Schedule routine checks of your system’s diagnostic reports and health dashboards.
Proactive monitoring can catch nascent issues before they become critical.
Training and Education: Invest in training your teams on the available diagnostic tools and their proper usage. A well-informed team is better equipped to identify and resolve issues quickly.
Integration for Holistic Views: Where possible, integrate insights from different diagnostic tools.
Combining data from communication platforms, CMS, and network monitoring can provide a more comprehensive and holistic view of your overall system health.
Document Internal Procedures: Create internal documentation for common diagnostic procedures and fixes.
This knowledge base can significantly speed up troubleshooting for recurring issues and onboard new team members more effectively.
Stay Updated: Software evolves, and so do its diagnostic capabilities.
Regularly check for new features, updates, and best practices related to your tools.
Staying current ensures you’re always leveraging the most effective diagnostic methods.
Conclusion
The world of communication and documentation software is rich with powerful, often overlooked, built-in diagnostic tools.
From the real-time data testing of industrial OPC servers to the comprehensive health checks of enterprise CMS platforms,
these features are designed to ensure reliability, optimize performance, and streamline troubleshooting.
By actively exploring and utilizing these hidden gems, you can transform your approach to system management from reactive firefighting to proactive maintenance.
So, take a moment to delve into the settings and documentation of your favorite tools.
You might just uncover a diagnostic superpower you never knew you had, ready to make your digital life a whole lot smoother.
Embrace these tools, and empower yourself to build more resilient and efficient digital environments.
References
1. [TOP Server Startup & Testing Tools]()
2. [CoreDial Diagnostics: Built In Diagnostic Tools]()
3. [Cisco Prime Collaboration]()
5. [Confluen