Hey there, fellow developers and tech enthusiasts!
Have you ever found yourself staring at a loading spinner that just won’t quit, or an application that feels sluggish and unresponsive?
If you’re working with Single-Page Applications (SPAs), chances are you’ve encountered performance bottlenecks.
It’s a common challenge, but one that’s entirely surmountable with the right knowledge and tools.
Today, I want to share some insights into identifying and resolving these pesky performance issues, ensuring your SPAs deliver a smooth, delightful user experience.
SPAs have revolutionized web development, offering dynamic and fluid interactions that mimic native desktop applications.
However, this power comes with its own set of complexities.
Unlike traditional multi-page applications, SPAs load most of their resources upfront and rely heavily on client-side rendering and API calls.
This architecture, while efficient in many ways, can introduce unique performance hurdles if not managed carefully.
But don’t worry, we’re going to break down the most common culprits and walk through actionable strategies to get your SPAs running at peak performance.

Videos are added as random thoughts 💭 💭 💭
Understanding the Core Bottlenecks
Let’s dive into the heart of the matter: what exactly causes SPAs to slow down?
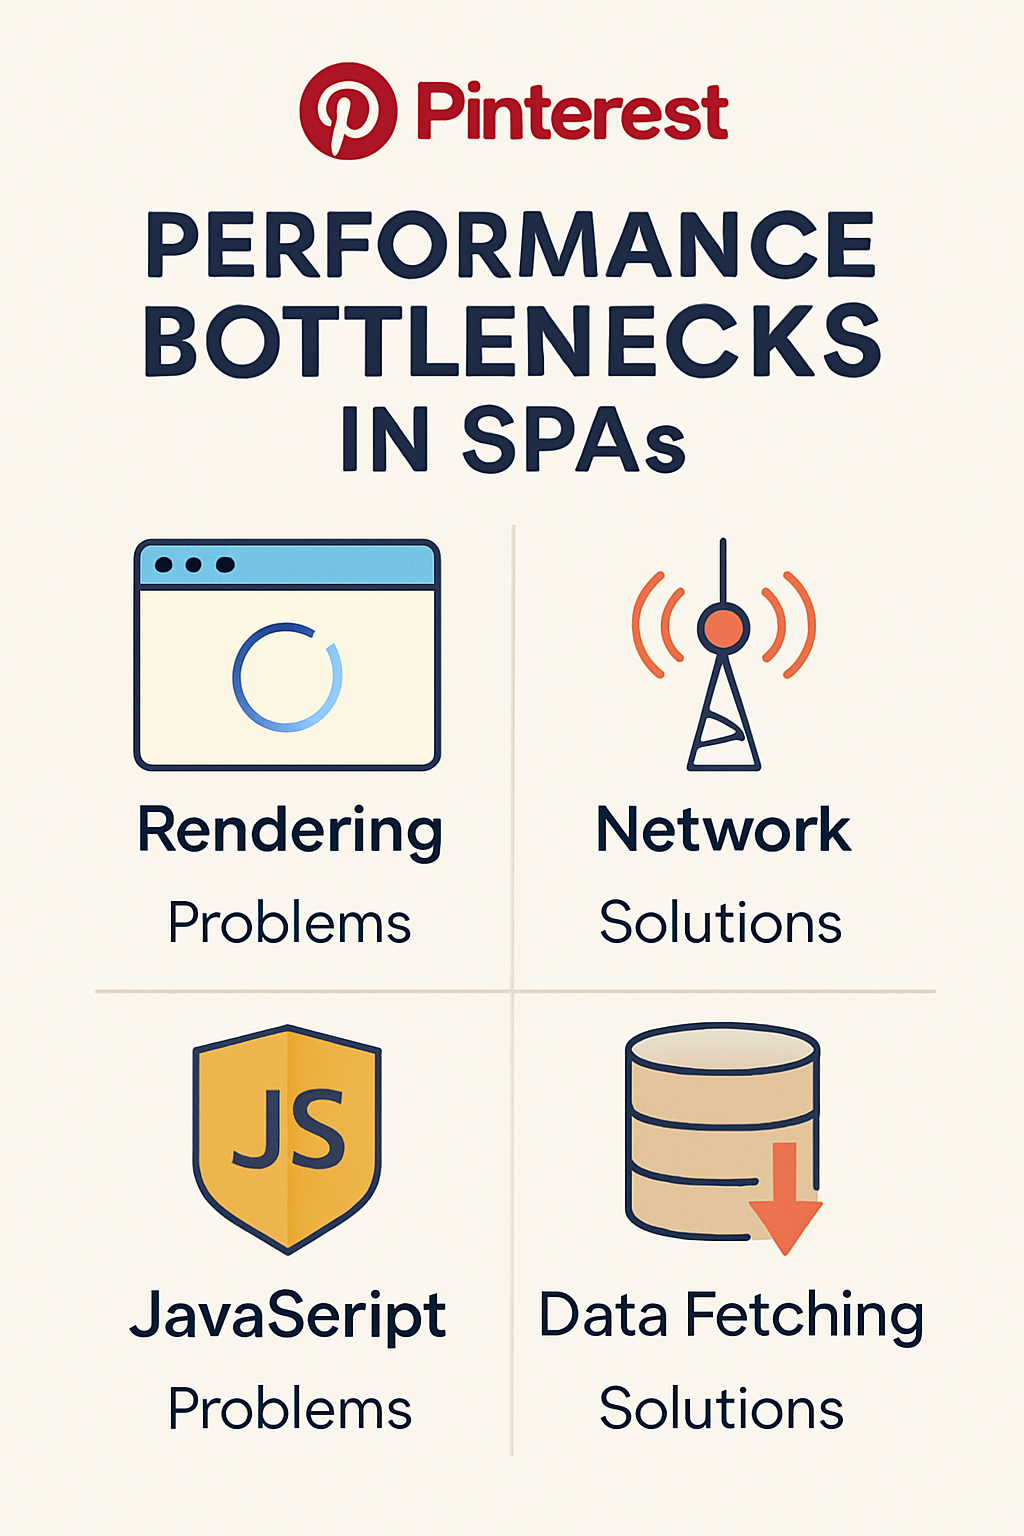
From my experience, the issues often fall into four main categories.
Understanding these will give us a solid foundation for effective troubleshooting.
1. Rendering Performance Issues
One of the first things users notice is how quickly content appears on their screen. In SPAs, rendering can be a significant bottleneck.
When your application has a large number of components or frequently re-renders parts of the UI unnecessarily,
it can put a heavy strain on the browser’s main thread.
This often leads to a sluggish user interface and a poor initial loading experience.
Common Problems:
Slow Initial Load: SPAs often require downloading a substantial amount of JavaScript, CSS, and other assets upfront.
If this initial bundle is too large, users on slower network connections will experience significant delays before anything is even displayed.
Large Component Trees & Frequent Re-renders: Complex UIs with deeply nested components can lead to performance issues.
Every time a state changes, the framework might re-evaluate and re-render a large portion of the component tree, even if only a small part of the UI actually needs to update.
This excessive work can block the main thread and make your application feel unresponsive.
Troubleshooting Solutions:
Code-Splitting & Lazy Loading: Instead of sending one massive JavaScript bundle to the user, break your application into smaller, manageable chunks.
Use techniques like code-splitting to load only the code necessary for the current view, and lazy loading to defer the loading of non-critical assets until they are actually needed.
This dramatically reduces the initial load time and improves perceived performance.
Virtual DOM & Memoization: Modern JavaScript frameworks like React, Vue, and Angular utilize a Virtual DOM to optimize rendering.
However, it’s crucial to use it effectively. Techniques like memoization (e.g.,
`React.memo`, `useMemo`, `useCallback`)
can prevent unnecessary re-renders of components by caching their results and only re-rendering if their props or state have actually changed.
This minimizes the work the browser has to do.
Server-Side Rendering (SSR) & Pre-rendering:
For content-heavy SPAs, consider implementing SSR or pre-rendering.
SSR renders the initial HTML on the server, sending a fully formed page to the browser.
This improves the initial load time and SEO. Pre-rendering is a similar concept, generating static HTML files at build time for specific routes.
2. Network Performance Issues
SPAs are chatty by nature.
They constantly communicate with backend APIs to fetch and update data.
If these network interactions aren’t optimized, they can quickly become a major bottleneck, leading to slow data retrieval and a frustrating user experience.
Common Problems:
Excessive API Requests: Making too many small, unoptimized API calls can flood the network and lead to increased latency.
Each request incurs overhead, and a large number of requests can quickly add up.
Large Asset Updates: While we discussed initial load, ongoing asset updates (e.g., new images, dynamic content) can also be heavy.
If not managed, these can consume significant bandwidth and slow down the application.
Long Load Times: This is a direct consequence of the above. Slow API responses or large data transfers mean users wait longer for content to appear or update.
Troubleshooting Solutions:
API Optimization: Design your APIs to be efficient.
This might involve using GraphQL to fetch only the data you need (avoiding over-fetching) or designing REST endpoints that provide all necessary data in a single request (avoiding under-fetching).
Batching multiple small requests into a single larger one can also significantly reduce network overhead.
Caching (HTTP/Service Workers): Implement robust caching strategies.
Leverage HTTP caching headers for static assets and API responses.
For more dynamic control, use Service Workers to cache network requests and serve content directly from the cache, providing an offline-first experience and dramatically speeding up subsequent loads.
Content Delivery Networks (CDNs): Distribute your static assets (JavaScript, CSS, images) across geographically dispersed servers using a CDN.
This reduces the physical distance between your users and your assets, leading to faster download times.
HTTP/2 or HTTP/3: Ensure your server supports modern HTTP protocols like HTTP/2 or HTTP/3.
These protocols offer features like multiplexing (sending multiple requests/responses over a single connection) and header compression, which can significantly improve network performance for SPAs.
3. JavaScript Performance Issues
JavaScript is the engine of your SPA. If this engine isn’t running smoothly, your entire application will feel sluggish.
Inefficient JavaScript code can lead to a variety of problems, from slow execution times to memory leaks that degrade performance over time.
Common Problems
Heavy Bundles: As mentioned before, large JavaScript bundles take longer to download, parse, and execute.
This directly impacts the time to interactive (TTI) metric, making your application feel unresponsive initially.
Inefficient Algorithms: Poorly optimized algorithms or complex computations running on the main thread can block the UI, leading to jank and freezes.
If your code is doing too much work at once, users will notice.
Excessive DOM Manipulation: Directly manipulating the Document Object Model (DOM) frequently can be very expensive.
Each change can trigger reflows and repaints, forcing the browser to recalculate layouts and redraw parts of the page,
which consumes significant CPU resources.
Memory Leaks: In long-running SPAs, if memory isn’t properly managed, objects that are no longer needed can remain in memory, leading to gradual memory consumption.
This eventually slows down the application and can even cause crashes.
Troubleshooting Solutions:
Code Optimization (Minification, Tree-shaking):
Always minify your JavaScript code to remove unnecessary characters and reduce file size.
Implement tree-shaking to eliminate dead code (unused modules or functions) from your bundles.
These techniques significantly reduce the amount of JavaScript the browser needs to process.
Web Workers: For computationally intensive tasks that don’t directly interact with the DOM, offload them to Web Workers.
Web Workers run in a separate thread, preventing these heavy operations from blocking the main UI thread and keeping your application responsive.
Debouncing/Throttling: When dealing with events that fire frequently (e.g., `scroll`, `resize`, `mousemove`, `input`), use debouncing or throttling.
Debouncing ensures a function is only called after a certain period of inactivity, while throttling limits the rate at which a function can be called.
This reduces the number of times expensive operations or API calls are triggered.
Memory Management: Regularly profile your application’s memory usage using browser developer tools.
Identify and fix memory leaks by ensuring that event listeners are properly removed, large objects are dereferenced when no longer needed, and closures don’t inadvertently hold onto unnecessary data.
Tools like the Chrome DevTools Performance monitor can be invaluable here.
4. Data Fetching Issues
Data is the lifeblood of most SPAs. How efficiently you fetch, process, and display this data directly impacts user experience.
Inefficient data fetching can lead to slow loading of content, unnecessary network traffic, and a general feeling of sluggishness.
Common Problems:
Over-fetching/Under-fetching: Over-fetching occurs when your API returns more data than the client actually needs, wasting bandwidth and processing power.
Under-fetching happens when a single API request doesn’t provide enough data, forcing the client to make multiple additional requests to gather all necessary information.
Lack of Data Caching: Repeatedly fetching the same data from the server without any caching mechanism can lead to redundant network requests and slower performance, especially for frequently accessed or static data.
Inefficient Event Handling: While related to JavaScript performance, inefficient event handling during data display can also contribute to data fetching issues.
If your application re-renders large parts of the UI or performs complex calculations every time new data arrives, it can negate the benefits of fast data retrieval.
Troubleshooting Solutions:
GraphQL/Optimized REST APIs: To combat over-fetching and under-fetching, consider using GraphQL, which allows clients to request exactly the data they need.
If you’re sticking with REST, design your API endpoints carefully to provide optimal data payloads for specific views, or implement techniques like field filtering and pagination.
Client/Server-side Caching: Implement robust caching strategies for your data.
On the client-side, use libraries like React Query, SWR, or Apollo Client (for GraphQL) to manage and cache data.
On the server-side, leverage database caching, CDN caching for API responses, or in-memory caches to speed up data delivery.
Efficient Event Listeners: Optimize your event listeners to ensure they are not causing unnecessary re-renders or computations when data changes.
Use techniques like event delegation, debouncing, and throttling (as mentioned in JavaScript performance) to manage how and when event handlers are executed.
Conclusion
Troubleshooting performance bottlenecks in Single-Page Applications can feel like a daunting task, but it’s an essential part of delivering a high-quality user experience.
By systematically addressing issues related to rendering, network communication, JavaScript execution, and data fetching, you can transform a sluggish application into a responsive and enjoyable one.
Remember, performance optimization is not a one-time fix; it’s an ongoing process of monitoring, testing, and refining.
I encourage you to start by identifying the most critical bottlenecks in your own SPAs using browser developer tools and performance monitoring services.
Implement the strategies we’ve discussed, and you’ll be well on your way to building faster, more efficient, and more user-friendly applications. Happy optimizing!
Quick Guide: SPA Performance Bottlenecks & Solutions
For a quick overview and easy sharing, here’s an infographic summarizing the key points:

