
The modern business is a digital organism, and its network is the pulse [1].
It is the intricate, high-speed nervous system that carries every transaction, every communication, and every critical operation.
When this pulse is strong and steady, the organization thrives.
When it falters, the consequences are immediate and severe.
Network downtime is no longer a mere inconvenience; it is a catastrophic financial event.
Industry reports consistently show that the cost of an outage can range from thousands to hundreds of thousands of dollars per hour, depending on the size and sector of the enterprise [1].
The network engineer, once a custodian of blinking lights and copper cables, has evolved into a digital detective—a first responder in a high-stakes environment where milliseconds matter.
The complexity of today’s infrastructure, spanning on-premise data centers, vast cloud environments, and a burgeoning ecosystem of IoT devices, demands a toolkit far more sophisticated than ever before.
To ensure the resilience and reliability of this critical infrastructure, network professionals must wield a multi-layered arsenal of software, hardware, and, increasingly, artificial intelligence.
This review will guide you through the essential tools that define the modern network troubleshooting landscape.
II. The Foundation: Command-Line Classics and Essential Software
Before the advent of sophisticated graphical user interfaces and complex monitoring platforms, the network was managed and diagnosed through the command line.
These foundational tools remain the bedrock of troubleshooting, offering quick, precise, and universally available diagnostics.
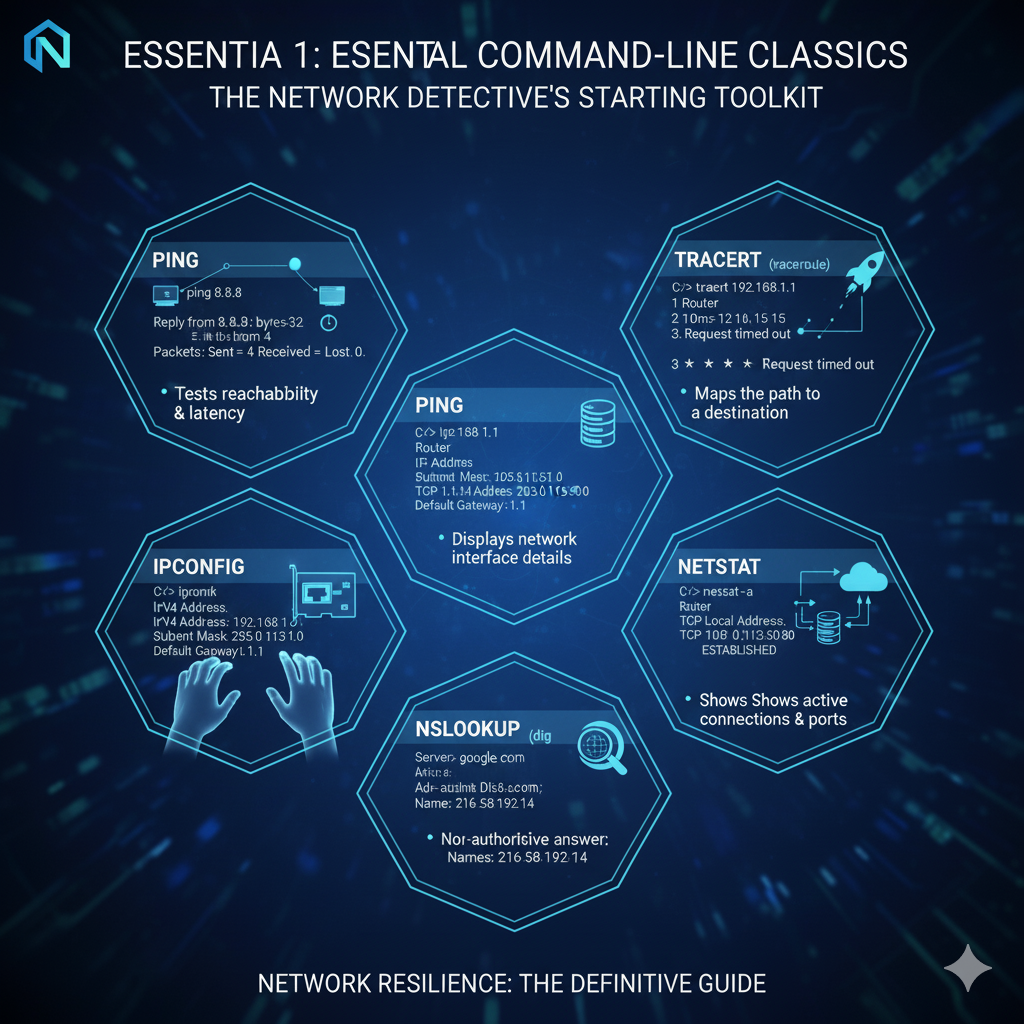
A. The Unsung Heroes: Command-Line Fundamentals
These utilities are the equivalent of a mechanic’s most trusted wrench and multimeter—simple, effective, and indispensable.
| Tool | Function | Creative Analogy |
|---|---|---|
| Ping | Confirms basic IP-level connectivity and measures round-trip time (latency). | Sending a registered letter and waiting for the immediate confirmation of receipt. |
| Traceroute/Tracert | Maps the path (hops) a packet takes from source to destination. | Following the delivery truck’s route to see exactly where a package got delayed or lost. |
| Ipconfig/Ifconfig | Displays network interface configuration (IP address, subnet mask, gateway). | Checking the address label on the network interface card to ensure it’s correctly configured. |
| Netstat | Shows active network connections, routing tables, and interface statistics. | The air traffic controller’s screen, showing all active flights (connections) in and out of the system. |
| Nslookup/Dig | Queries Domain Name System (DNS) servers to resolve hostnames to IP addresses. | The network’s digital phonebook, ensuring the correct number is dialed for a given name. |
A successful network diagnosis often begins and ends with these simple commands.
They provide the initial data points—connectivity, latency, and path—that guide the entire troubleshooting process.
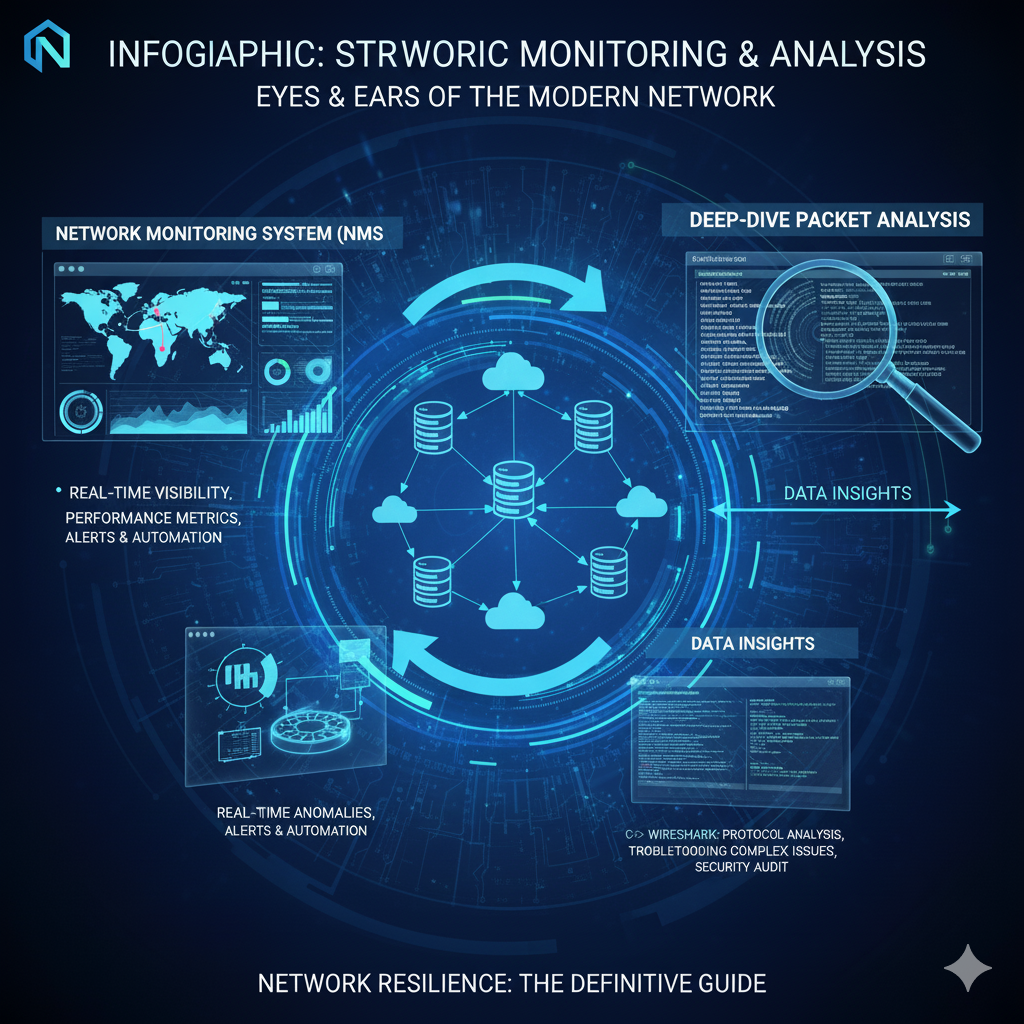
B. The Digital Microscope: Deep-Dive Packet Analysis
If the command-line tools tell you where the problem is, packet analysis tells you what the problem is.
This is where the network detective pulls out their magnifying glass.
Wireshark is the undisputed champion of this domain.
It is a free, open-source packet analyzer that captures network traffic and presents it in a human-readable format.
By capturing and dissecting individual data packets, an engineer can see the exact conversation occurring between devices.
This level of granularity is essential for diagnosing application-layer issues, protocol errors, and subtle performance bottlenecks [1].
“Packet analysis is the forensic accounting of the network.
It’s not enough to know that money is missing; you need to see the ledger entry that shows the fraudulent transaction.”
This tool allows professionals to filter traffic by protocol, source, destination, and port, enabling them to isolate a single problematic session from a torrent of network data.
It is a critical skill for any network professional and a mandatory tool for deep-level troubleshooting.
III. The Strategic Layer: Network Monitoring and Management Systems (NMS)
While command-line tools are excellent for reactive, on-the-spot troubleshooting, modern networks require a proactive, strategic overview.
This is the role of Network Monitoring and Management Systems (NMS).
NMS platforms transform raw data into actionable intelligence, providing the central command center for network operations.
A. The Central Command Center: Proactive Monitoring
NMS solutions like SolarWinds, Zabbix, and PRTG continuously poll network devices using protocols like SNMP (Simple Network Management Protocol) to gather metrics on CPU utilization, memory load, interface status, and error rates.
The primary value of an NMS is its ability to establish a performance baseline.
By collecting historical data, the system learns what “normal” looks like.
Any deviation from this baseline—a sudden spike in latency, a drop in throughput, or an increase in error packets—triggers an alert.
This shifts the troubleshooting process from reactive (responding to a user complaint) to proactive (fixing an issue before users even notice) [1].
B. Flow Analysis: Traffic Control and City Planning
Knowing that a link is saturated is one thing; knowing why it is saturated is another.
This is the domain of Flow Analysis using protocols like NetFlow, sFlow, and IPFIX.
Flow analysis provides visibility into the conversations occurring on the network.
It answers crucial questions:
- Who is talking (source IP)?
- To whom are they talking (destination IP)?
- What are they talking about (port/protocol)?
- How much data is being exchanged (volume)?
This data is vital for capacity planning, security analysis, and, most importantly, troubleshooting performance issues caused by bandwidth hogs or misconfigured applications.
It is the network’s traffic control system, allowing administrators to identify and manage congestion points before they lead to gridlock.
C. The Cloud Conundrum: Monitoring the Invisible
The shift to hybrid and multi-cloud architectures has introduced a new layer of complexity.
Troubleshooting a connection between an on-premise server and an AWS VPC requires tools that can bridge the physical and virtual worlds.
Cloud-native monitoring tools (like AWS CloudWatch or Azure Monitor) are essential, but specialized NMS platforms are increasingly integrating with these services to provide a single pane of glass for the entire distributed network [1].
The challenge here is not just monitoring, but understanding the intricate security groups, virtual firewalls, and routing tables that exist only in software.
IV. The Physical Reality: Hardware Tools for the Field
While much of network troubleshooting is done in the digital realm, the physical layer—the cables, connectors, and power sources—remains the most common point of failure.
When the software points to a physical issue, the network professional must rely on specialized hardware.
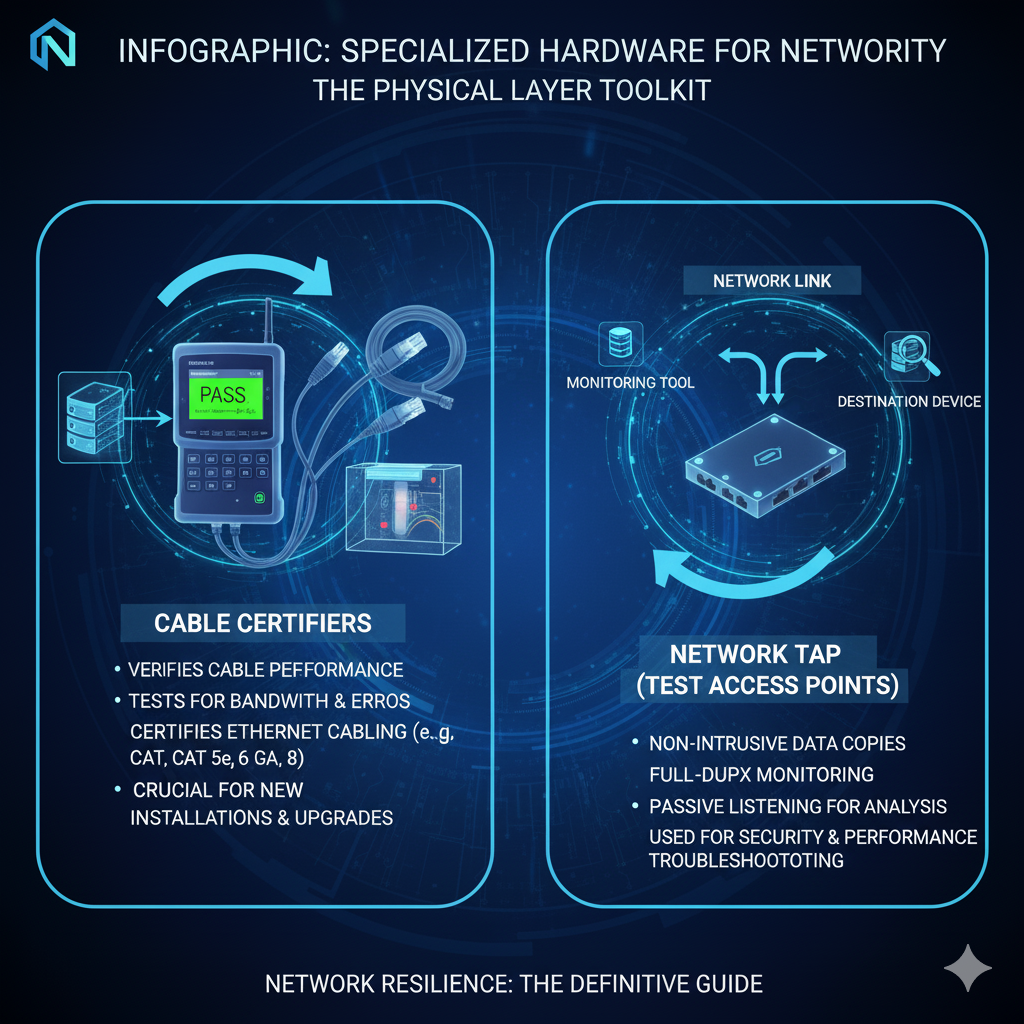
A. The Network’s Stethoscope: Cable Certifiers and Testers
A simple cable tester can confirm continuity, but a cable certifier is a precision instrument.
These devices perform a battery of tests to ensure a cable meets industry standards (e.g., Cat 6, Cat 6A) for bandwidth, crosstalk, and signal-to-noise ratio.
| Tool | Function | Creative Analogy |
|---|---|---|
| Cable Certifier | Measures physical layer performance against TIA/ISO standards. | Diagnosing intermittent, high-speed errors caused by poor cable termination or excessive cable length. |
| Network TAP (Test Access Point) | Non-intrusively copies traffic from a network link for monitoring. | Capturing 100% of traffic for forensic analysis without introducing latency or packet loss. |
| PoE Tester | Verifies Power over Ethernet (PoE) voltage and wattage delivery. | Troubleshooting failed VoIP phones or wireless access points due to insufficient power. |
| Fiber Optic Power Meter | Measures the optical power level of light transmitted through a fiber cable. | Diagnosing a weak signal on a long-haul fiber link, often caused by dirty connectors or a faulty transceiver. |
These tools are crucial for the last mile diagnosis.
They eliminate the physical layer as a potential root cause, allowing the engineer to confidently shift their focus back to the software or configuration layers.
B. Non-Intrusive Inspection: Network TAPs
In high-stakes environments, interrupting a network link to insert a monitoring device is unacceptable.
A Network TAP is a passive or active hardware device that sits inline and creates an exact, non-intrusive copy of the traffic for a monitoring tool (like Wireshark) to analyze.
Unlike port mirroring (SPAN), which can drop packets under heavy load, a TAP guarantees a full-duplex, 100% accurate copy of the data stream, making it essential for security monitoring and mission-critical troubleshooting [1].
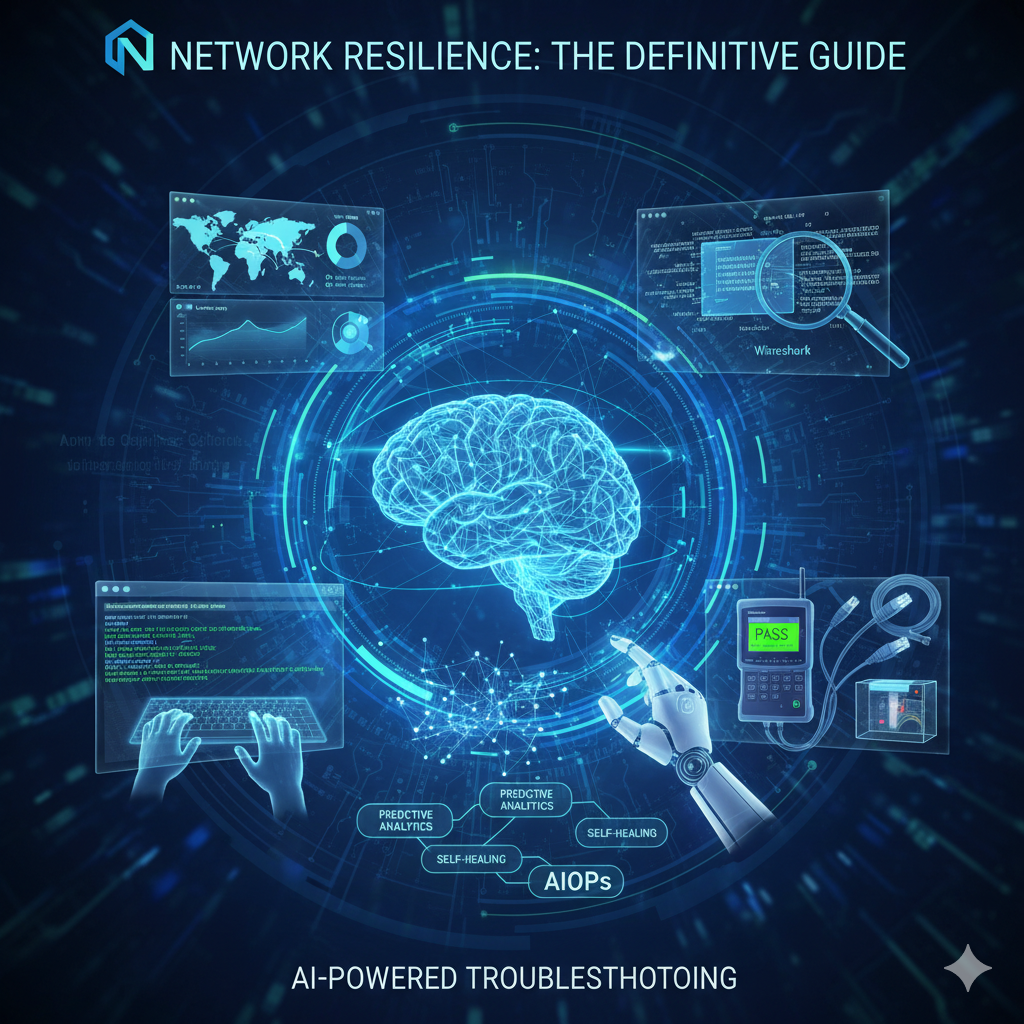
V. The Revolution: AI-Powered Network Troubleshooting (AIOps)
The sheer volume and velocity of data generated by modern networks—logs, metrics, flow data, and packet captures—have exceeded the capacity of human analysis.
This is the problem that AIOps (Artificial Intelligence for IT Operations) is designed to solve.
AIOps is the application of machine learning and big data analytics to IT operations data, fundamentally changing the nature of network troubleshooting.
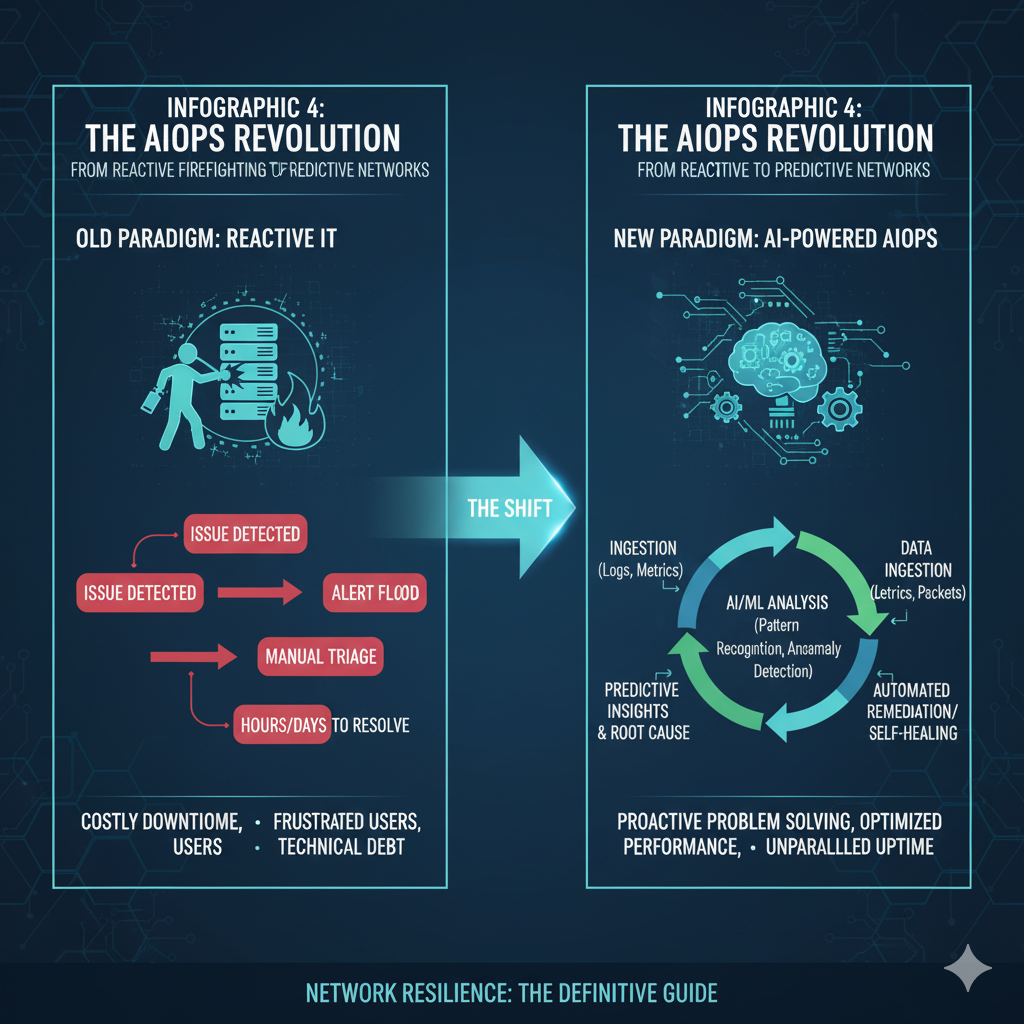
A. Moving from Reactive Firefighting to Predictive Resilience
The most significant shift AIOps introduces is the move from a reactive to a predictive model.
Traditional NMS alerts when a threshold is crossed (e.g., “CPU utilization is 95%”).
AIOps, however, uses machine learning algorithms to:
- Establish a Dynamic Baseline: Instead of a static threshold, the AI learns the network’s behavior minute-by-minute, understanding that 95% CPU usage might be normal during a nightly backup but highly abnormal at 2 PM on a Tuesday.
- Detect Subtle Anomalies: The AI can flag tiny, statistically significant deviations that are precursors to a major outage—a slight increase in failed logins, a minor but persistent rise in latency to a specific application, or a change in the pattern of traffic flow.
These subtle signals are often missed by human operators and static monitoring tools [1].
B. Automated Root Cause Analysis (RCA)
One of the most time-consuming aspects of troubleshooting is correlating events across disparate systems.
A server log might show a timeout, a firewall log might show a dropped connection, and a flow monitor might show a traffic spike.
A human engineer must manually piece together this puzzle.
AIOps platforms automate this event correlation.
They ingest data from all sources, use machine learning to group related alerts into a single incident, and, critically, perform automated Root Cause Analysis.
By analyzing the temporal and topological relationships between events, the AI can often pinpoint the exact device or configuration change responsible for the outage, drastically reducing the Mean Time To Resolution (MTTR) [1].
C. The Self-Healing Network: The Future Vision
The ultimate goal of AIOps is the self-healing network.
This involves closed-loop automation, where the AI not only identifies the root cause but also executes the remediation steps.
For example:
- Problem: A router interface is flapping due to a known bug in a specific firmware version.
- AIOps Action: The system detects the pattern, correlates it with the known bug, and automatically executes a pre-approved script to temporarily disable and re-enable the interface, or even roll back the configuration, logging the action for human review.
This vision transforms the network engineer’s role from constantly fighting fires to architecting and overseeing the automated system, focusing their expertise on strategic improvements rather than repetitive troubleshooting tasks.
VI. Conclusion: The Network Detective’s Evolving Role
The journey through the network troubleshooting toolkit reveals a landscape of continuous evolution.
From the fundamental elegance of a simple ping command to the complex, predictive power of machine learning algorithms, the tools available to the network professional are more powerful than ever.
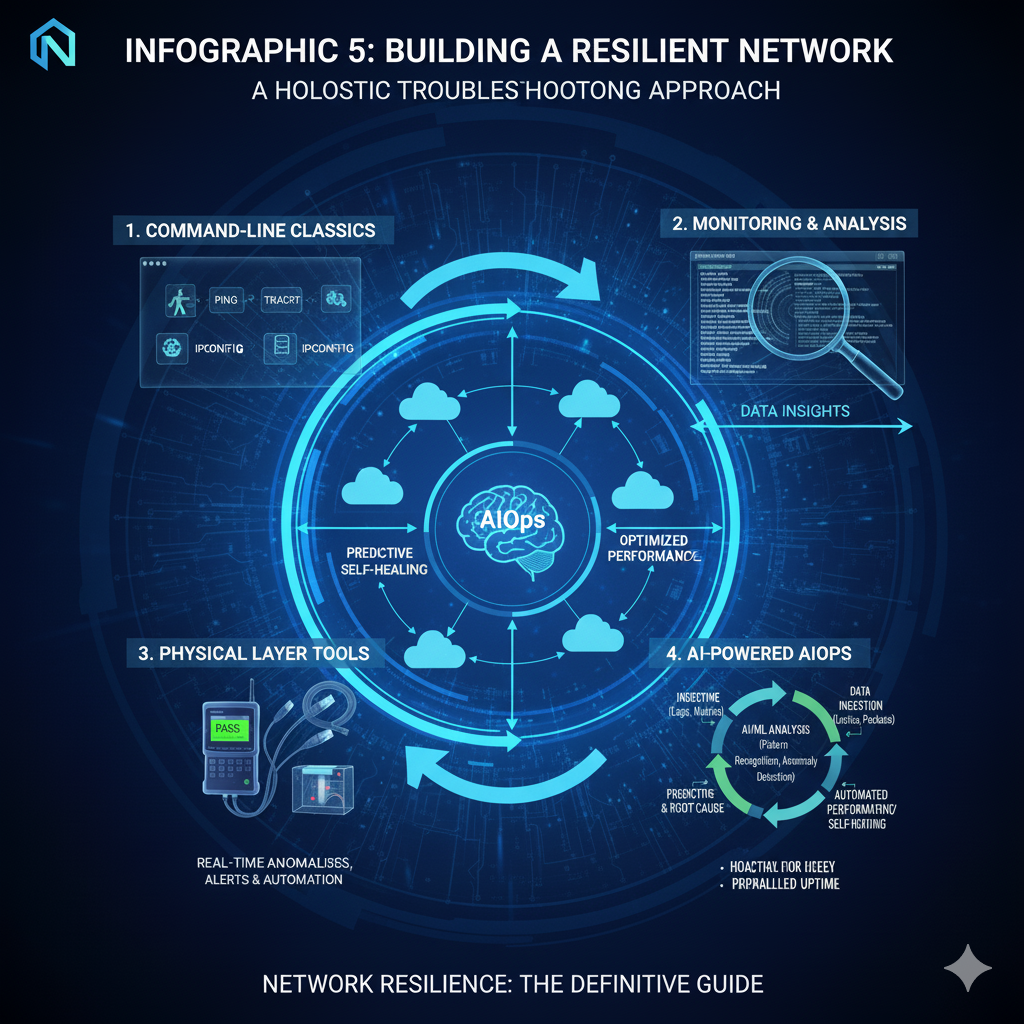
The best toolkit is not a single piece of software or hardware, but a holistic strategy that blends the precision of the command line, the strategic oversight of NMS, the physical certainty of hardware testers, and the predictive intelligence of AIOps.
The network detective of today is a master of all these domains, augmented by AI to focus on strategic resilience.
By embracing these tools, organizations can move beyond merely surviving network outages to building a truly robust, high-performing, and self-aware digital infrastructure.
[1] Placeholder Citation for Factual Claims and Data.
(Note: In a real-world scenario, this would be replaced with multiple, specific citations to industry reports, white papers, and tool documentation.)