

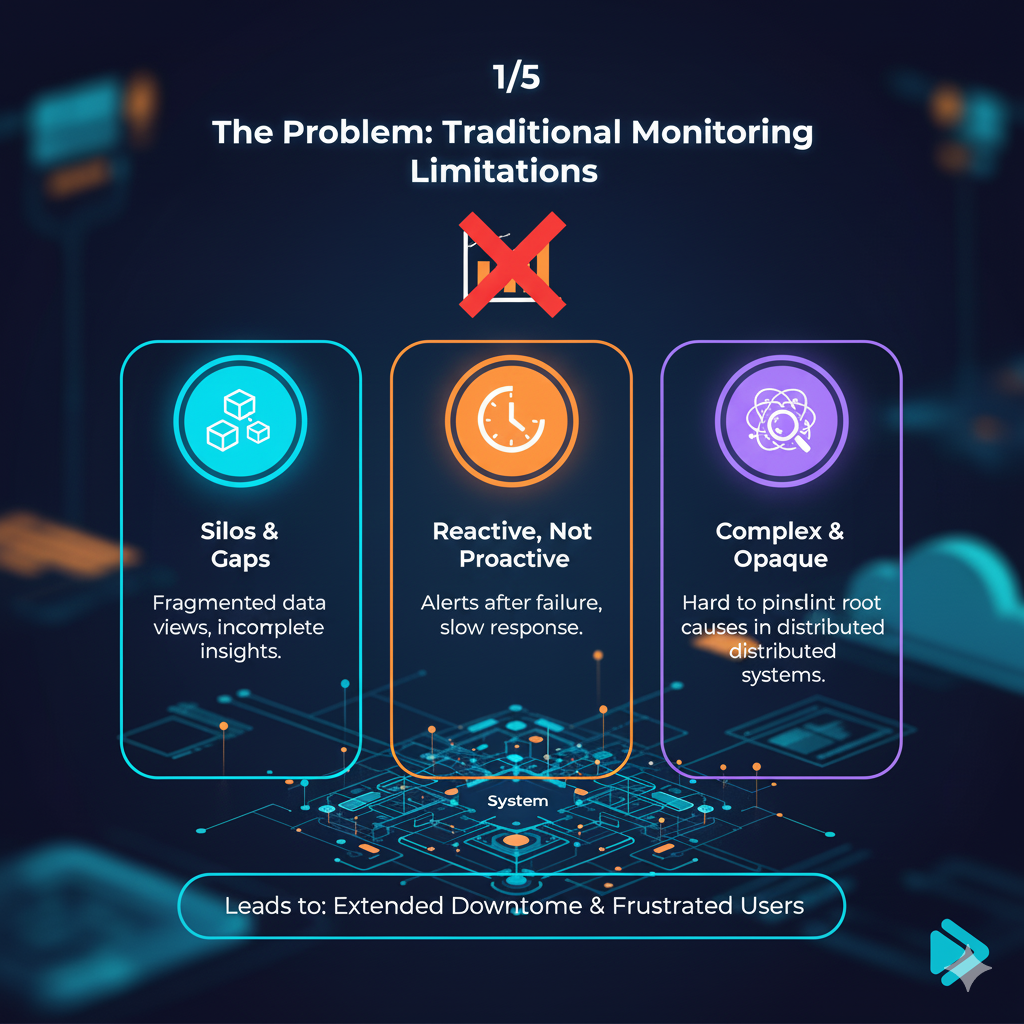
Monitoring has long been the cornerstone of IT operations, relying on dashboards and alerts to indicate when something is wrong.
It addresses ‘known unknowns’ – anticipated metrics and events for which alerts are configured.
Like a car’s dashboard, monitoring tells you if the engine is overheating or fuel is low, but not why or how to fix it.
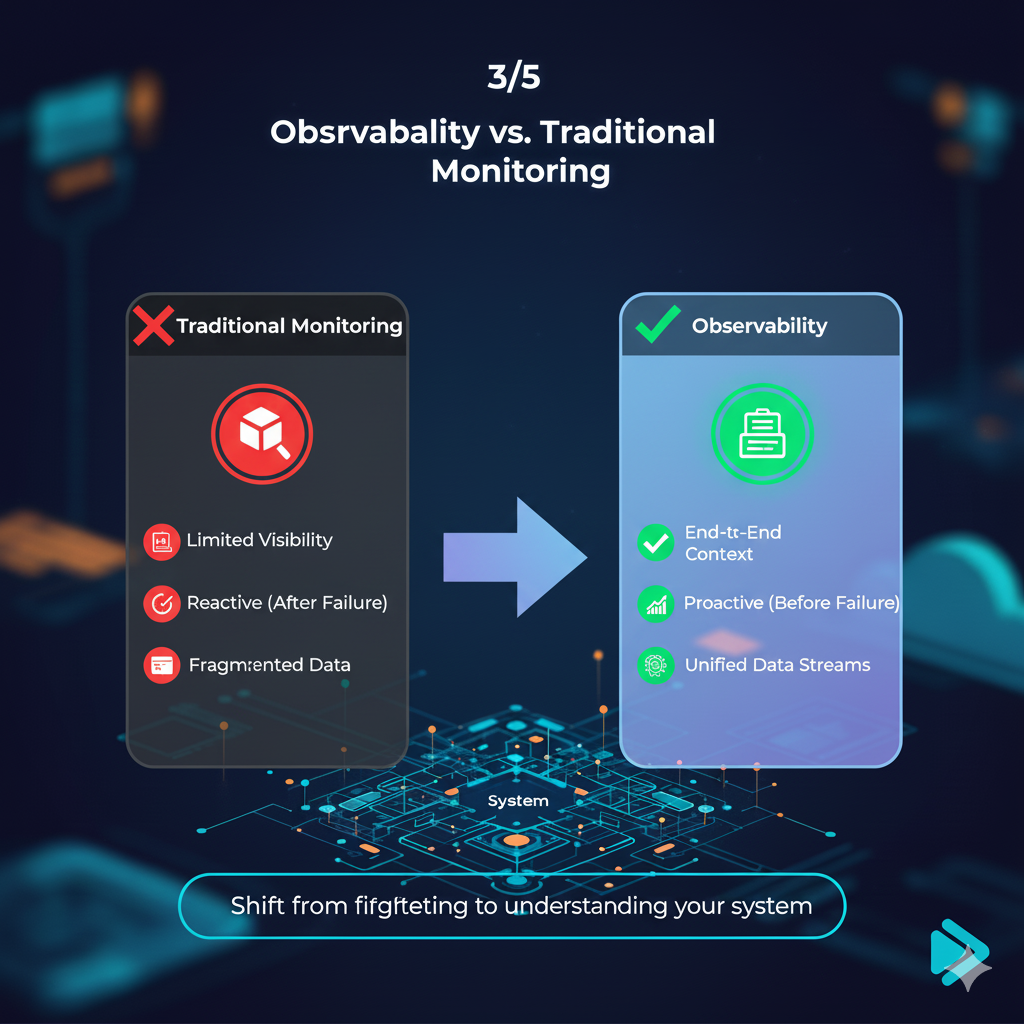
Observability is a deeper capability: inferring a system’s internal states from its external outputs [1].
It’s like a comprehensive diagnostic toolkit, allowing you to ask arbitrary questions about performance and behavior, even for novel issues.
It reveals not just what is happening, but why and how to effectively address it.
This distinction is vital in modern, complex, distributed systems where ‘unknown unknowns’ are common.
Cloud-native architectures, microservices, and dynamic environments create complexity that traditional monitoring struggles with.
Observability provides the necessary holistic visibility to navigate this complexity [2].
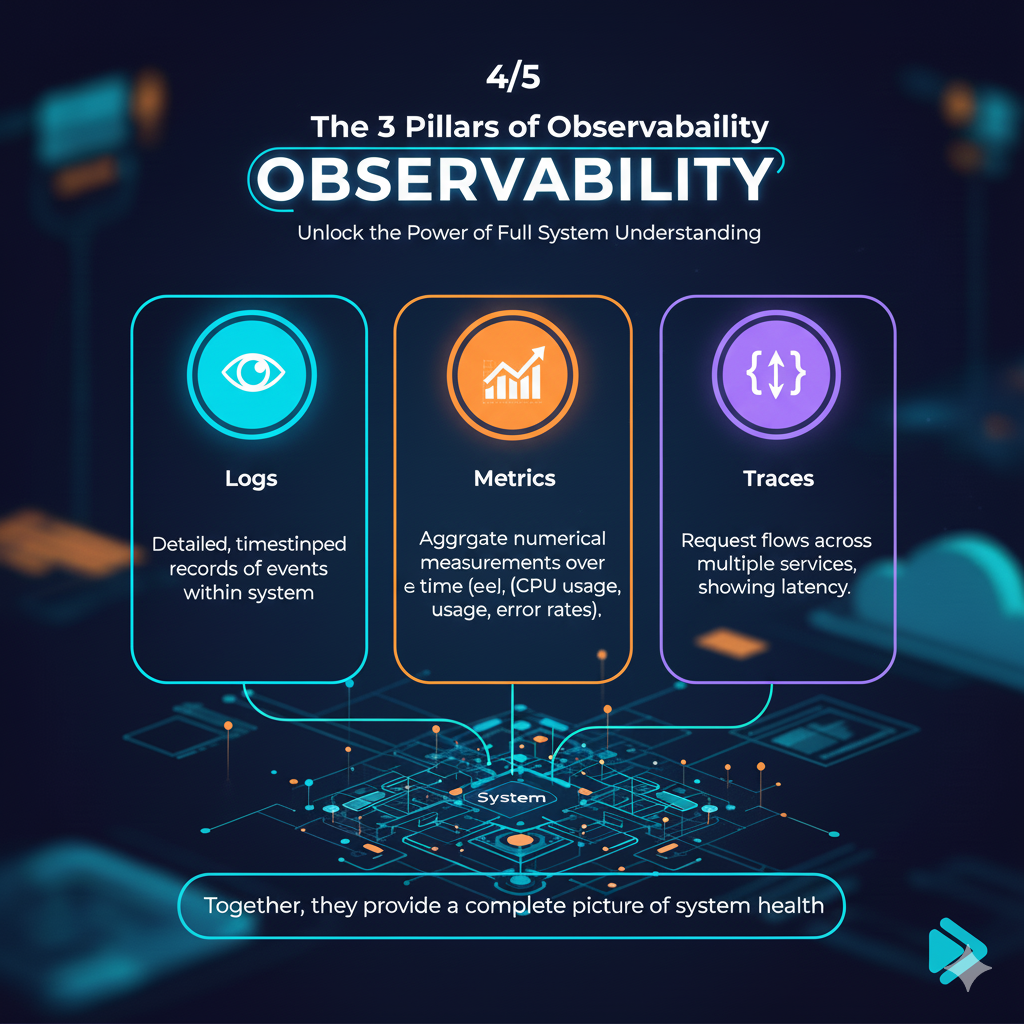
The Three Pillars of Observability
Observability is built upon three fundamental types of telemetry data, often called the ‘three pillars’:
1. Metrics
Metrics are numerical measurements collected over time, offering quantitative insights into system performance and resource utilization.
Structured for efficient storage and querying, they include CPU usage, memory, request rates, and error counts.
Metrics are ideal for identifying trends, baselines, and high-level anomalies [1].
2. Logs
Logs are timestamped records of discrete system events, providing a textual narrative of what, when, and often why.
They range from plain text to structured JSON, with structured logs offering richer context and easier querying.
Logs are often the first resource engineers consult to understand event sequences leading to a problem [1].
3. Traces
Traces represent the end-to-end journey of a request through a distributed system.
Each operation, a ‘span,’ contains crucial data.
Visualizing traces helps track request flow across services, pinpointing bottlenecks, latency, and failure points.
Traces are indispensable for understanding microservices dependencies and interactions [1].
Beyond the Pillars: Modern Observability
While logs, metrics, and traces are foundational, modern observability in complex cloud environments extends further.
For comprehensive understanding, contemporary solutions also incorporate:

Metadata: Contextual information about system components, helping to enrich telemetry data.
User Behavior: Insights into how end-users interact with your applications, revealing pain points and optimizing user journeys.
Topology and Network Mapping: A clear understanding of the interconnections and dependencies between services and infrastructure components.
Code-level Details: Granular information about code execution, enabling deep-dive troubleshooting directly to the source of the problem [2].
Integrating these diverse data sources into a unified platform is key.
This allows for correlation and analysis beyond isolated data points, providing a holistic view of system health and performance, truly unlocking proactive issue resolution.
Why Observability is Your Ally for Proactive Resolution
Observability excels in shifting from reactive firefighting to proactive problem-solving.
It equips teams with insights to anticipate, detect, and resolve issues before they escalate. Here’s how:
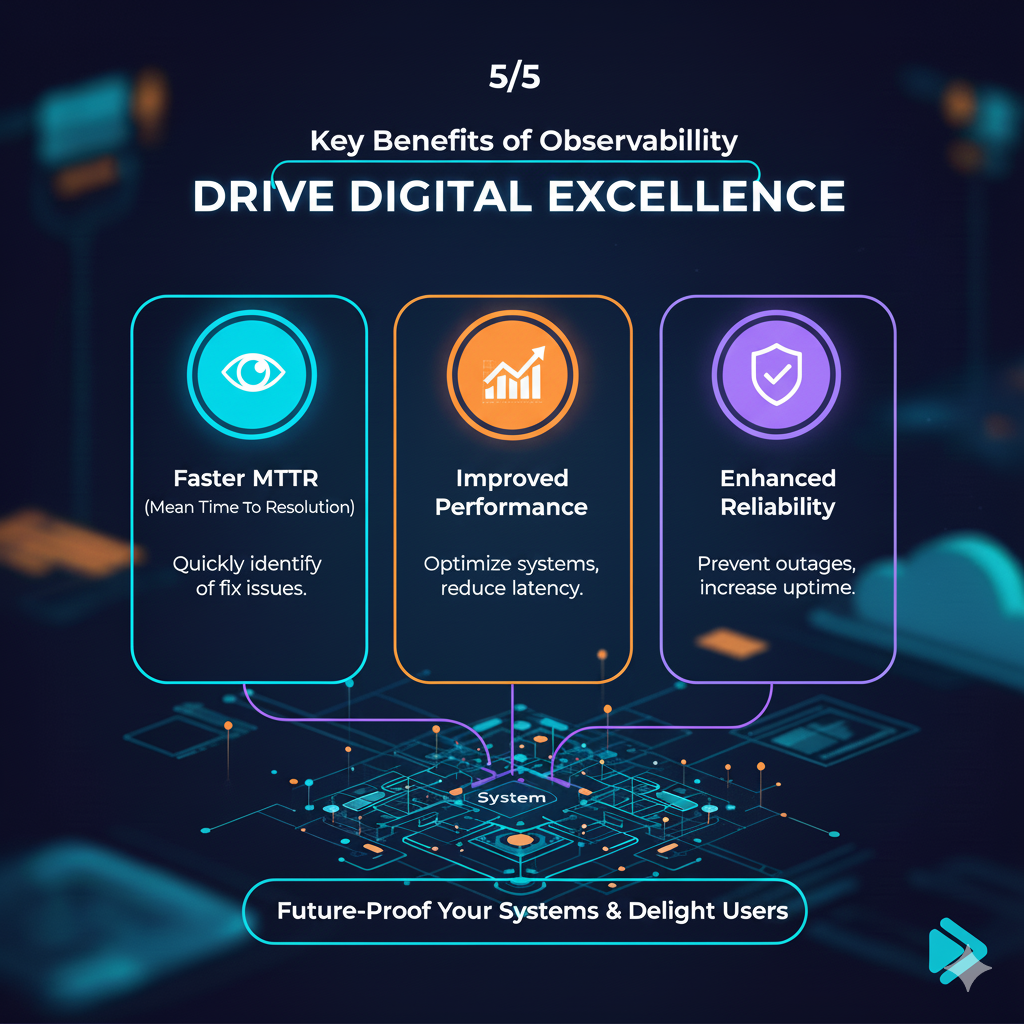
1. Faster Incident Detection and Resolution
Observability platforms continuously collect and analyze real-time telemetry, enabling rapid detection of anomalies and deviations.
Advanced analytics, including machine learning, identify subtle patterns, leading to lower Mean Time To Detect (MTTD) and improved system uptime.
Traces are invaluable for quickly identifying root causes by mapping request flow and problem propagation across distributed systems [3].
2. Pinpointing Root Causes Across Distributed Systems
In microservices, a single issue can cascade.
Observability provides comprehensive, multi-layer visibility, allowing engineers to trace requests, pinpoint errors, and analyze root causes via correlated logs, metrics, and traces.
This unified view eliminates disparate tools, leading to accurate diagnostics and faster fixes.
Imagine seeing the exact service or code line of failure, dramatically reducing debugging time [3].
3. Strengthening System Reliability and Preventing Outages
By continuously monitoring Service-Level Indicators (SLIs) like latency, error rates, and availability, observability platforms enable proactive issue resolution before user impact.
Setting thresholds and proactive alerts allows intervention during performance degradation, preventing outages.
This strengthens system resilience, reduces SLA violations, and builds customer trust [3].
4. Boosting Developer Productivity
Developers often spend significant time debugging.
Observability streamlines this by providing clear, centralized visibility into system operations.
Integrated telemetry allows developers to quickly understand issues without extensive domain knowledge or manual debugging.
This reduces context switching, fosters collaboration, and enables developers to focus on innovation, leading to faster development cycles and higher job satisfaction [3].
5. Increasing DevOps Agility and Deployment Confidence
For DevOps and CI/CD, observability is transformative.
It provides granular insights into new code behavior in production, enabling early regression detection, performance validation during canary/A/B deployments, and automated rollbacks for critical post-deployment issues.
This results in safer, faster delivery cycles and increased deployment confidence [3].
6. Turning Telemetry Data into Business and Customer Insights
Observability offers profound business value beyond technical teams.
By correlating technical metrics with business context—user flows, transaction failures, engagement metrics—organizations gain a deeper understanding of end-user interactions.
This identifies pain points, optimizes user journeys, and aligns product development with customer needs and business outcomes, making IT a true business enabler [3].
7. Reducing Costs Through Smarter Resource Monitoring
Inefficient resource utilization leads to significant operational costs, especially in cloud environments.
Observability platforms provide detailed insights into resource usage patterns, highlighting underutilized or over-provisioned resources.
This enables data-driven decisions on infrastructure scaling, reducing waste and optimizing spending.
It’s about maximizing value from existing infrastructure and making smarter future investments [3].
Implementing Observability: Best Practices for Your Website
Adopting an observability-driven approach is a journey that requires a strategic mindset, a commitment to continuous improvement, and a willingness to adapt.
It’s not merely about installing new tools; it’s about fundamentally changing how your teams perceive and interact with your systems.
By embracing these best practices, you can lay a solid foundation for a robust observability strategy that drives proactive issue resolution and continuous operational excellence.
Here are key practices to guide your implementation:
1. Define Clear Objectives and KPIs
Before selecting tools, clearly define your observability goals: reduce MTTR, improve customer satisfaction, or optimize costs?
Defining specific Key Performance Indicators (KPIs) and Service Level Objectives (SLOs) will focus efforts and measure success [4].
2. Foster a Culture of Collaboration
Observability is a team sport. Break down silos between development, operations, and QA teams.
Encourage shared ownership of system health and performance.
Unified telemetry understanding fosters better communication and faster problem-solving [4].
3. Implement Comprehensive Instrumentation
Ensure all website components and underlying infrastructure—front-end, backend, databases, network—are properly instrumented.
Collect relevant logs, metrics, and traces from every system part. OpenTelemetry is an excellent open-source, vendor-agnostic standard for application instrumentation [4].
4. Centralize and Correlate Telemetry Data
Avoid fragmented data. Collect all logs, metrics, and traces into a single, unified observability platform.
Centralization is crucial for correlating data across sources, providing a holistic view, and enabling rapid analysis.
A good platform allows seamless navigation from high-level metric anomalies to specific logs and traces to pinpoint root causes [4].
5. Leverage High-Cardinality Data
Enrich telemetry data with high-cardinality attributes: user IDs, session IDs, transaction IDs, deployment versions, geographical locations.
This enables granular filtering and analysis, pinpointing the exact context of an issue, such as specific affected users or transactions [4].
6. Embrace the Core Analysis Loop
Observability is an ongoing cycle:
Collect, Analyze, Act, Learn. Continuously gather data, perform freeform investigations, take decisive action, and learn from each incident to improve systems and processes.
This iterative approach fosters continuous improvement and resilience [4].
7. Automate Alerts and Integrate with Incident Response
Configure intelligent alerts that trigger when predefined thresholds are breached or anomalies are detected.
These alerts should be highly contextual, leveraging the rich telemetry data collected to provide actionable insights rather than just noise.
Integrate these alerts seamlessly with your existing incident response workflows, ensuring the right teams are notified immediately through appropriate channels.
Furthermore, for critical deployments, consider implementing automated rollbacks based on real-time observability data.
This proactive measure can prevent widespread impact by automatically reverting to a stable state if critical issues are detected post-deployment, significantly reducing Mean Time To Recovery (MTTR) and safeguarding user experience [3].
Conclusion
Mastering observability is essential for resilient, high-performing websites and digital services.
Moving beyond traditional monitoring to a holistic, data-driven approach empowers teams to understand system dynamics, anticipate problems, and resolve them proactively.
This minimizes downtime, improves user experience, drives innovation, boosts productivity, and ultimately contributes to your business’s bottom line.
Embrace observability to transform website issue resolution from reactive struggle to proactive strength.
References
[1] Splunk. (n.d.). *What is Observability? An Introduction*. Retrieved from
[2] Dynatrace. (2024, June 26). *What is observability? Not just logs, metrics, and traces. Retrieved from
[3] Splunk. (n.d.). 7 Strategic Benefits of Observability for Modern Enterprises. Retrieved from
[4] Honeycomb. (n.d.). *What Is Observability? Key Components and Best Practices*. Retrieved from