
Welcome, tech enthusiasts and troubleshooting heroes! 🤓
In the vast landscape of computing, application failures are an inevitable, albeit frustrating, part of the journey.
Whether you’re a seasoned developer, a dedicated IT professional, or just someone trying to figure out why a program crashed, having the right tools can turn hours of head-scratching into minutes of decisive action.
Today, we’re diving deep into one of the most powerful and indispensable utilities in the Sysinternals suite: Process Monitor.
This remarkable tool, often affectionately called “ProcMon,” is your X-ray vision into the heart of your Windows operating system, revealing every file, registry, process, and network activity an application undertakes.
“The only way to do great work is to love what you do.” – Steve Jobs
And when it comes to debugging, we definitely love finding those elusive bugs!
Are you ready to transform your debugging process? Let’s get started!
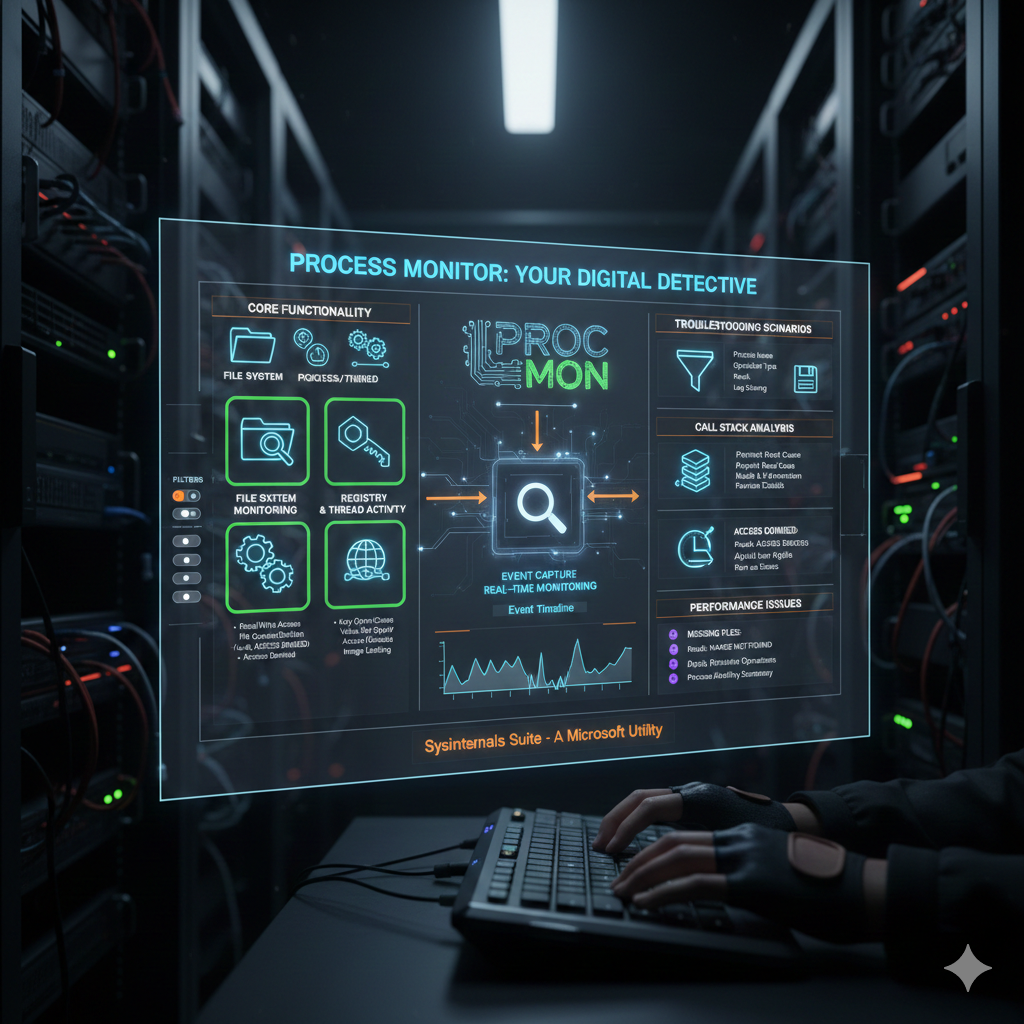
What is Process Monitor? Your Digital Detective 🕵️♂️
Process Monitor is an advanced monitoring tool for Windows that shows real-time file system, Registry, and process/thread activity.
It combines the features of two legacy Sysinternals utilities, Filemon and Regmon, and adds a wealth of enhancements, including rich and non-destructive filtering, comprehensive event properties such as session IDs and user names, reliable process information, full thread stacks, simultaneous logging to a file, and much more.
In essence, it captures every interaction an application has with the operating system, providing an invaluable forensic trail.
Why is Process Monitor so Crucial for Debugging? 💡
Imagine an application failing without a clear error message or crashing inexplicably.
Traditional debugging tools might struggle to pinpoint the exact moment or cause of failure, especially when it involves low-level system interactions.
This is where Process Monitor shines.
It allows you to see:
- If an application is trying to access a file that doesn’t exist or permissions are denied.
- Which registry keys are being read, written, or failing to open.
- The creation or termination of processes and threads.
- Network connections being attempted or established.
By observing these granular events, you can often deduce the root cause of an issue that would otherwise remain a mystery.
Getting Started: Installation and First Launch 🚀
Process Monitor is part of the Sysinternals suite, a collection of powerful utilities created by Mark Russinovich and Bryce Cogswell, now owned by Microsoft.
It’s incredibly lightweight and doesn’t require any complex installation.
Downloading Process Monitor
You can download Process Monitor directly from the official Microsoft Learn website.
Download Process Monitor from Microsoft Learn
Simply download the zip file, extract its contents to a convenient location (e.g., C:\Sysinternals), and you’re ready to go.
Running Process Monitor
To run Process Monitor, simply double-click Procmon.exe.
It’s recommended to run it as an administrator to ensure it can capture all system events.
Upon launch, you’ll be greeted by a torrent of real-time events – a dizzying display of activity.
Don’t be overwhelmed! This is where filtering comes into play.
Understanding the Interface: Your Debugging Dashboard 📊
The Process Monitor interface, while dense, is logically organized.
Here are the key components:
Event Display Window
This is the main pane where all captured events are displayed.
Each row represents an event, and columns provide details such as:
- Time of Day: When the event occurred.
- Process Name: The executable responsible for the event.
- PID: Process ID.
- Operation: The type of action (e.g., CreateFile, RegOpenKey, WriteFile).
- Path: The target of the operation (e.g., file path, registry key).
- Result: The outcome of the operation (e.g., SUCCESS, NAME NOT FOUND, ACCESS DENIED).
- Detail: Additional information about the event.
Toolbar Icons
The toolbar provides quick access to essential features:
| Icon | Description |
|---|---|
| Capture Events (magnifying glass) | Toggles event capturing on/off. Essential for starting and stopping monitoring. |
| Auto Scroll | Keeps the display scrolled to the newest events. |
| Filter (funnel) | Opens the filter dialog – your most powerful tool! |
| Highlight (color palette) | Applies a custom color to specific events. |
| Reset Filter | Clears all active filters. |
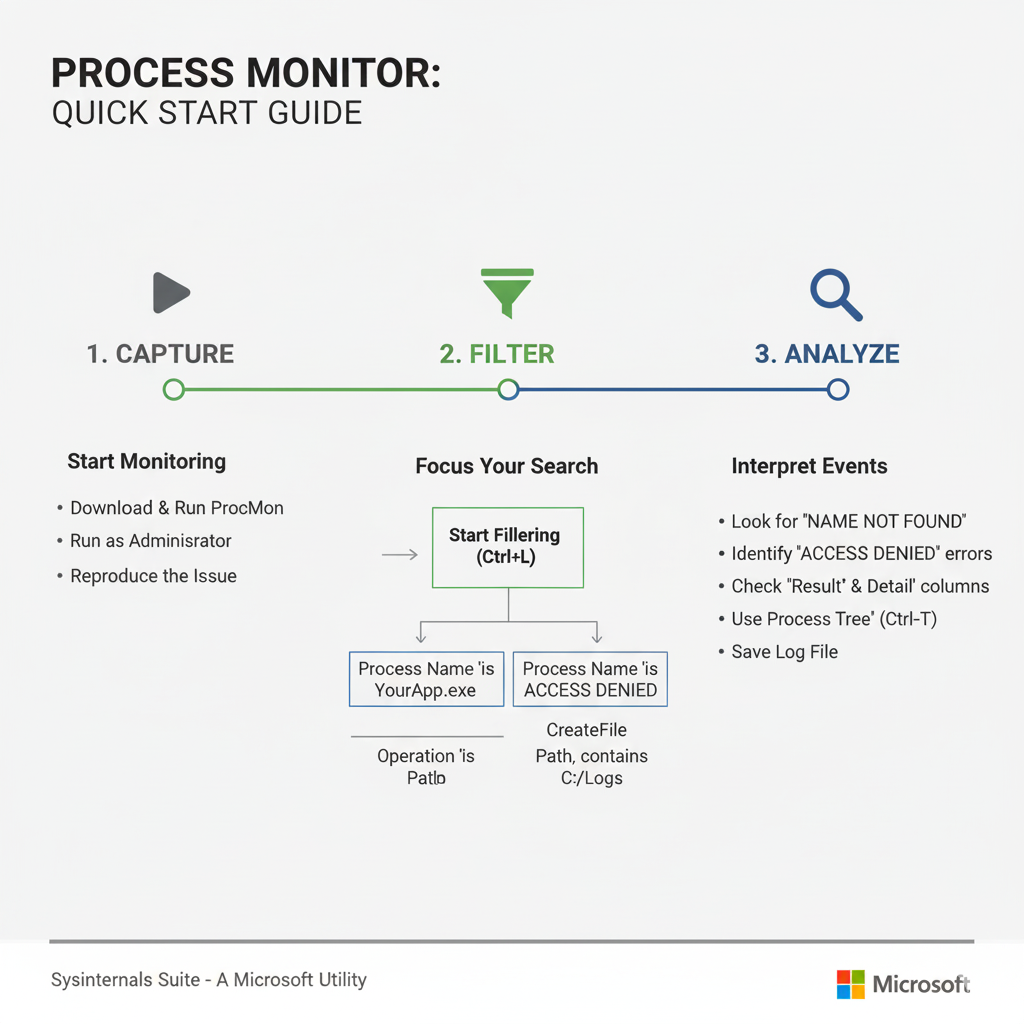
The Art of Filtering: Taming the Data Deluge 🌊
Without filtering, Process Monitor data is like trying to drink from a firehose.
Effective filtering is the key to isolating the relevant events.
Basic Filtering Techniques
Click the funnel icon or go to Filter > Filter… (Ctrl+L) to open the filter dialog.
Here, you can set rules based on various event properties.
Common filters for debugging application failures include:
- Process Name: Filter by the executable name of the failing application (e.g.,
Process Name is YourApp.exe Include). This is your first and most important filter. - Result: Look for problematic outcomes (e.g.,
Result is ACCESS DENIED Include,Result is NAME NOT FOUND Include). - Operation: Focus on specific types of interactions (e.g.,
Operation is CreateFile Includeto see file creation attempts). - Path: If you suspect issues with a specific file or registry key, filter by its path (e.g.,
Path contains C:\Program Files\YourApp Include).
You can combine multiple filter rules to narrow down your search even further.
Pro Tip: Always start broad with your process name, then progressively add more specific filters as you get closer to the problem. 🔍
Debugging Scenarios: Putting Process Monitor to Work 🛠️
Scenario 1: “Application Cannot Find File” Errors
This is a classic.
An application crashes with a message indicating a missing file, but you’re sure the file is there.
Here’s how Process Monitor helps:
- Start Process Monitor, set a filter for your application’s process name.
- Clear the existing capture (Ctrl+X).
- Start capturing events.
- Launch the problematic application until it crashes.
- Stop capturing.
- Now, filter by
Result is NAME NOT FOUND Include.
You’ll likely see the exact file path the application was trying to access and failed to find.
It might be looking in the wrong directory, or a dependent DLL is indeed missing from a specific search path.
Scenario 2: “Access Denied” or Permissions Issues
Applications often fail due to insufficient permissions to read/write files or registry keys.
Process Monitor is perfect for diagnosing these:
- Follow steps 1-5 from Scenario 1.
- Filter by
Result is ACCESS DENIED Include.
This will show you precisely which file or registry key the application attempted to interact with but was denied access.
Armed with this information, you can adjust permissions accordingly, either on the file/folder/key itself or by running the application with elevated privileges (if appropriate).
Scenario 3: Application Freezing or Slow Performance
Sometimes an application doesn’t crash but becomes unresponsive or extremely slow.
This could be due to excessive I/O operations or deadlocks.
While Process Monitor can’t directly show deadlocks, it can reveal intensive activity:
- Start Process Monitor with a filter for your application.
- Let it capture events while the application is misbehaving.
- Stop capturing and analyze the event trace.
Look for a rapid succession of similar operations (e.g., thousands of QueryKey or ReadFile operations in a short period).
This might indicate a loop or inefficient code trying to access resources repeatedly.
Use the Tools > Process Activity Summary to get an overview of operations per process. This can quickly highlight an application performing an unusually high number of specific operations.
You can also use Tools > File Summary or Registry Summary for aggregated views.
Advanced Techniques: Unleashing Full Power 💥
Boot Logging
Some application failures occur very early in the system boot process, before you can even launch Process Monitor.
Process Monitor offers a solution: Boot Logging.
Go to Options > Enable Boot Logging.
After enabling, restart your computer.
Process Monitor will capture events from the very start of the boot process.
Upon logging back in, launch Process Monitor, and it will prompt you to save the captured boot log.
This is invaluable for debugging services or startup applications that fail early.
How to Geek: Use Process Monitor to Track Down Problems
Saving and Analyzing Logs
For complex issues or for sharing with colleagues, saving your capture log is essential.
Go to File > Save… and choose a location.
You can save it as a native PML file (which retains all event details and can be reopened in Process Monitor) or in other formats like CSV for external analysis.
Event Properties and Call Stacks
Double-click on any event in the main display to open its Event Properties dialog.
This window provides even more detail, including:
- Process Tab: Full command line, parent process, user, and integrity level.
- Stack Tab: This is a goldmine for developers! It shows the full call stack of the operation, indicating which functions within the application (and Windows itself) led to the event. This can pinpoint the exact line of code responsible for an error.
“Debugging is like being a detective in a crime movie where you are also the murderer.” – Filipe Fortes
Comparing Logs
A powerful technique is to compare a “working” scenario log with a “failing” scenario log.
Capture events when the application works correctly, then capture again when it fails.
By comparing the differences, you can often spot the crucial event that diverged.
Tips and Best Practices for Effective Debugging with Process Monitor ✨
Be Specific with Filters
The more precise your filters, the easier it will be to find the needle in the haystack.
Avoid capturing too much irrelevant data.
Isolate the Problem
Before using Process Monitor, try to reproduce the application failure in the simplest possible way.
Close other unnecessary applications to reduce background noise.
Understand Common Results
Familiarize yourself with common Result values:
SUCCESS: The operation completed successfully.NAME NOT FOUND: The file, path, or registry key could not be found.ACCESS DENIED: Permissions prevented the operation.BUFFER OVERFLOW: Usually harmless, often indicates an attempt to read data into a buffer that was too small, followed by a successful retry.NO SUCH FILE: Similar to NAME NOT FOUND for file operations.
Use Process Tree
Go to Tools > Process Tree (Ctrl+T) to visualize parent-child relationships between processes.
This is useful for understanding how your application launches other executables or services.
Microsoft Scripting Guys: A Weekend Scripter – How to Use Process Monitor
Beyond Process Monitor: The Sysinternals Ecosystem 🌐
Process Monitor is just one jewel in the Sysinternals crown.
Other tools that complement it include:
- Process Explorer: A super-charged Task Manager replacement to view running processes, open handles, and DLLs.
- Autoruns: Shows you all programs configured to run during system boot or login.
- TCPView: Displays all active TCP and UDP connections on your system.
Learning to use these tools in conjunction with Process Monitor will elevate your troubleshooting skills dramatically.
Explore the Full Sysinternals Suite
Here is an infographic showcasing the core components of Process Monitor:
Windows Central: How to use Process Monitor on Windows 10
Conclusion: Your Debugging Superpower Unlocked! 🦸♀️
Process Monitor might seem intimidating at first glance, but with a little practice and a clear understanding of its filtering capabilities, it becomes an indispensable ally in your debugging toolkit.
It demystifies application failures by exposing the underlying system interactions, transforming guesswork into informed analysis.
From pinpointing missing files to uncovering permission woes and performance bottlenecks, Process Monitor empowers you to diagnose and resolve even the most stubborn application issues.
So, the next time an application throws a tantrum, don’t despair!
Launch Process Monitor, put on your detective hat, and get ready to unravel the mystery.
Happy debugging!
Official Process Monitor Documentation
“The best way to predict the future is to create it.” – Peter Drucker
And by mastering tools like Process Monitor, you’re creating a future of more stable and reliable applications! 🌟