
⚡
The performance of modern peripherals is inextricably linked to the integrity and efficiency of their communication protocols. 🖥️
High-speed interfaces like USB 3.x/4.0, Thunderbolt, and PCI Express (PCIe) are marvels of engineering, but their complexity introduces new layers of potential failure. 🔧
When a peripheral suffers from intermittent disconnects, reduced throughput, or data corruption, the root cause often lies in a subtle violation of the underlying protocol specification. ⚠️
This requires moving beyond simple driver checks and employing specialized tools to “decode the data stream” at the physical and logical layers. 🤓
This article provides an in-depth look at the advanced techniques and instrumentation necessary to diagnose and resolve complex peripheral communication protocol bottlenecks. 🔬
The Protocol Stack: Where Failures Hide 🏗️
Peripheral communication is governed by a layered protocol stack. Troubleshooting requires identifying which layer is failing.
| Layer | Description | Common Failure Symptoms | Advanced Diagnostic Tool |
|---|---|---|---|
| Physical Layer (PHY) | Electrical signaling, timing, voltage levels, and clock recovery | Link training failures, excessive bit errors, poor eye-diagram quality | Oscilloscope, Bit Error Rate Tester (BERT) |
| Data Link Layer | Packetization, error detection (CRC), flow control, and link management | Repeated packet retries (NAKs), link state machine stalls, high error rates reported by host | Protocol Analyzer |
| Transaction Layer | Data transfer services, transaction ordering, and address routing (PCIe TLP, USB Transfer) | Transaction timeouts, incorrect memory addressing, data corruption | Protocol Analyzer |
| Software/Application Layer | Drivers, OS calls, and application-specific commands | Driver crashes, application freezes, incorrect device enumeration | Software Debugger, System Log Analysis |
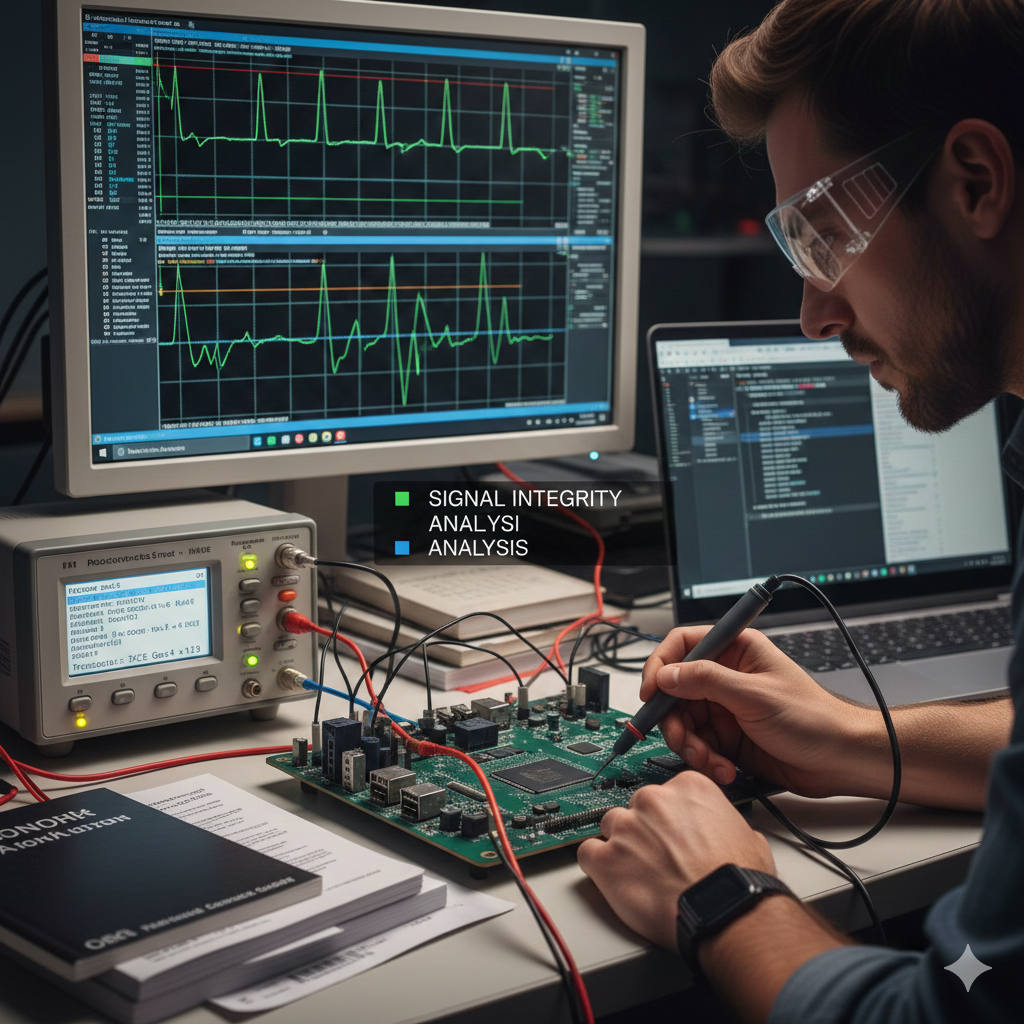
Phase 1: Advanced Physical Layer Analysis 🔌
Before data can be correctly interpreted, the electrical signal must be clean. Failures at the Physical Layer are often the source of intermittent, high-speed issues. ⚡
Eye Diagram Analysis 👁️
The Eye Diagram is the single most important tool for assessing the quality of a high-speed digital signal. 📊
It is created by overlaying many cycles of the digital signal onto a single display, triggered by the data rate.
Interpretation: A wide-open “eye” indicates a clean signal with good timing and voltage margins. A closed or distorted eye indicates signal integrity issues such as jitter, noise, or inter-symbol interference (ISI). Eye diagrams reveal subtle flaws invisible to software diagnostics.
Application: A distorted eye diagram often points to a problem with the cable, connector, or transmitter/receiver equalization settings. For example, a PCIe link that fails to train to Gen 4 speeds may show a severely closed eye due to signal loss over the trace or cable. 🔍
Time Domain Reflectometry (TDR) 🌊
TDR is used to characterize the impedance of the transmission line (cable, PCB trace).
Application: By sending a fast-rise-time pulse down the line and observing the reflections, TDR can precisely locate impedance mismatches caused by damaged cables, poor soldering, or faulty connectors. ⚡
An intermittent connection will show up as a highly variable impedance signature, often correlating with physical movement. TDR is essential for high-speed data integrity analysis.
Phase 2: Protocol Analysis with Specialized Tools 🛠️
For diagnosing issues at the Data Link and Transaction Layers, a dedicated Protocol Analyzer (PA) is indispensable. Unlike a logic analyzer, a PA decodes traffic into human-readable form. 📡
USB Protocol Analysis 🖱️
- Non-Intrusive Monitoring: A high-end USB PA sits passively between host and device, capturing all traffic without affecting timing.
- Error Detection: The PA flags protocol violations, such as CRC Errors indicating packet-level data corruption.
- NAK/Retry Storms: A peripheral repeatedly responds with NAK, forcing host retries and reducing throughput.
- Babble/J-State Errors: Indicates peripheral is transmitting outside its allocated slot, causing bus stalls.
PCIe Protocol Analysis 💻
- LTSSM Debugging: The PA captures link training failures through the Link Training Status State Machine.
- Transaction Layer Packet (TLP) Analysis: Ensures data routing is correct; detects Unsupported Request (UR) or Completion Timeout (CT).
- Flow Control Monitoring: Detects deadlocks when FC credits run out, stalling transmission.
Phase 3: Advanced Diagnostic Workflow 🔬
Correlating Protocol Errors with Physical Events 🖥️
Use a Protocol-Aware Oscilloscope or synchronized PA + DSO setup to trigger on protocol events like CRC errors and capture the physical waveform. 📈
If CRC errors consistently correlate with eye diagram collapses, the root cause is confirmed as a signal integrity issue rather than controller logic. This method isolates the exact moment of failure.
Error Logging and Reporting 📝
Modern OS and chipsets provide advanced error reporting.
PCIe AER logs correctable and uncorrectable errors. Tools like lspci -vvv (Linux) or vendor-specific utilities can identify devices with the highest error counts.
USB Device Descriptors can be analyzed to verify capability mismatches that may lead to host-side errors.
Phase 4: Resolution Strategies ⚙️
- Firmware Compliance Testing: Ensure peripheral firmware passes USB-IF or PCI-SIG workshops.
- Driver Optimization: Match transfer types to application (Isochronous, Bulk, Interrupt) and tune buffer sizes.
- Signal Conditioning: Use equalization tuning for PCIe/USB and certified cables for Thunderbolt/USB 4.0.
- Cable Replacement: Certified active cables with re-timers/re-drivers ensure a clean eye diagram.
Conclusion 🏆
Advanced peripheral communication troubleshooting requires expertise in protocol layers and high-end diagnostic equipment. 🧩
By systematically analyzing Physical, Data Link, and Transaction Layers using Protocol Analyzers, Oscilloscopes, and TDR, technicians can move beyond guesswork. 🛠️
Decoding the data stream enables precise identification of root causes, whether marginal signals, flow control deadlocks, or link training failures. ✅
Ultimately, this restores the peripheral to its intended high-performance state. Precision, reliability, and throughput are restored. 🎯
References 📚
[1] PCI-SIG. Troubleshooting PCI Express Link Training and Protocol Issues. 🔗 Link
[2] Total Phase. About the USB Protocol, Common USB Bus Errors, and How to Troubleshoot Them. 🔗 Link
[3] Keysight. Illuminate High-Speed PCIe Lanes with Protocol Analyzers. 🔗 Link
[4] Analog Devices. AN-1144: Measuring Output Ripple and Switching Transients in Switching Regulators. 🔗 Link
[5] Total Phase. The Advantages of Protocol Analyzers for Debugging. 🔗 Link
https://youtu.be/USBProtocolDemo
https://youtu.be/PCIeAnalyzerGuide
https://youtu.be/SignalIntegrity101
—