
The transition from monolithic applications to architectures built on microservices and containerization represents one of the most significant paradigm shifts in modern software development [1].
While this shift offers undeniable benefits—including enhanced scalability, technological diversity, and independent deployment cycles—it simultaneously introduces a new layer of operational and debugging complexity [2].
The very nature of a distributed system, where a single user request might traverse dozens of services, containers, and network hops, transforms a simple stack trace into a distributed forensic investigation.
This article serves as a comprehensive guide to mastering the art and science of debugging complex, containerized microservices architectures, providing the tools, strategies, and best practices necessary to maintain stability and performance in a highly dynamic environment.
The Core Debugging Challenges in a Distributed World
Debugging a monolith was relatively straightforward: a single process, a single log file, and a single debugger attachment point.
In a microservices environment, these certainties vanish.
The challenges are systemic and require a fundamental change in how we approach troubleshooting [3].
1. Ephemeral and Immutable Infrastructure
Containers, by design, are ephemeral; they are meant to be disposable and easily replaced.
When a container fails, it is often terminated and restarted by the orchestrator (like Kubernetes) before a human can even connect to it.
This immutability prevents the traditional practice of SSH-ing into a server to poke around or install debugging tools on the fly [4].
2. Asynchronous Communication and Network Latency
Microservices communicate using various protocols, often asynchronously via message queues (e.g., Kafka, RabbitMQ) or event streams.
A failure in one service might manifest as a delayed or missing response in a completely different service hours later, making the causal link difficult to establish [5].
Furthermore, network latency and transient failures between services can introduce non-deterministic bugs that are impossible to reproduce locally.
3. The Lack of a Global View
Each service maintains its own state, its own logs, and its own metrics.
There is no single “master log” that captures the entire lifecycle of a user request from end-to-end.
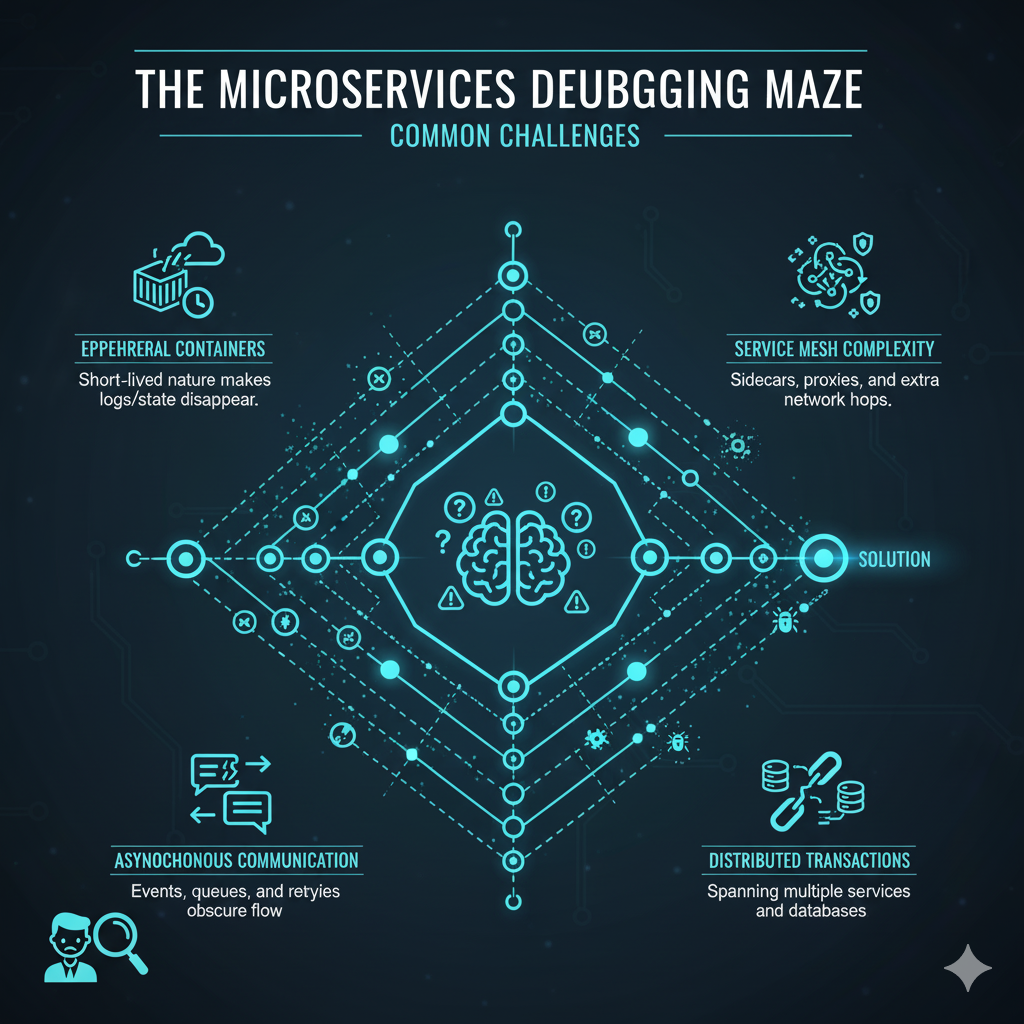
This fragmentation necessitates a unified approach to observability to stitch together the narrative of a transaction [6].
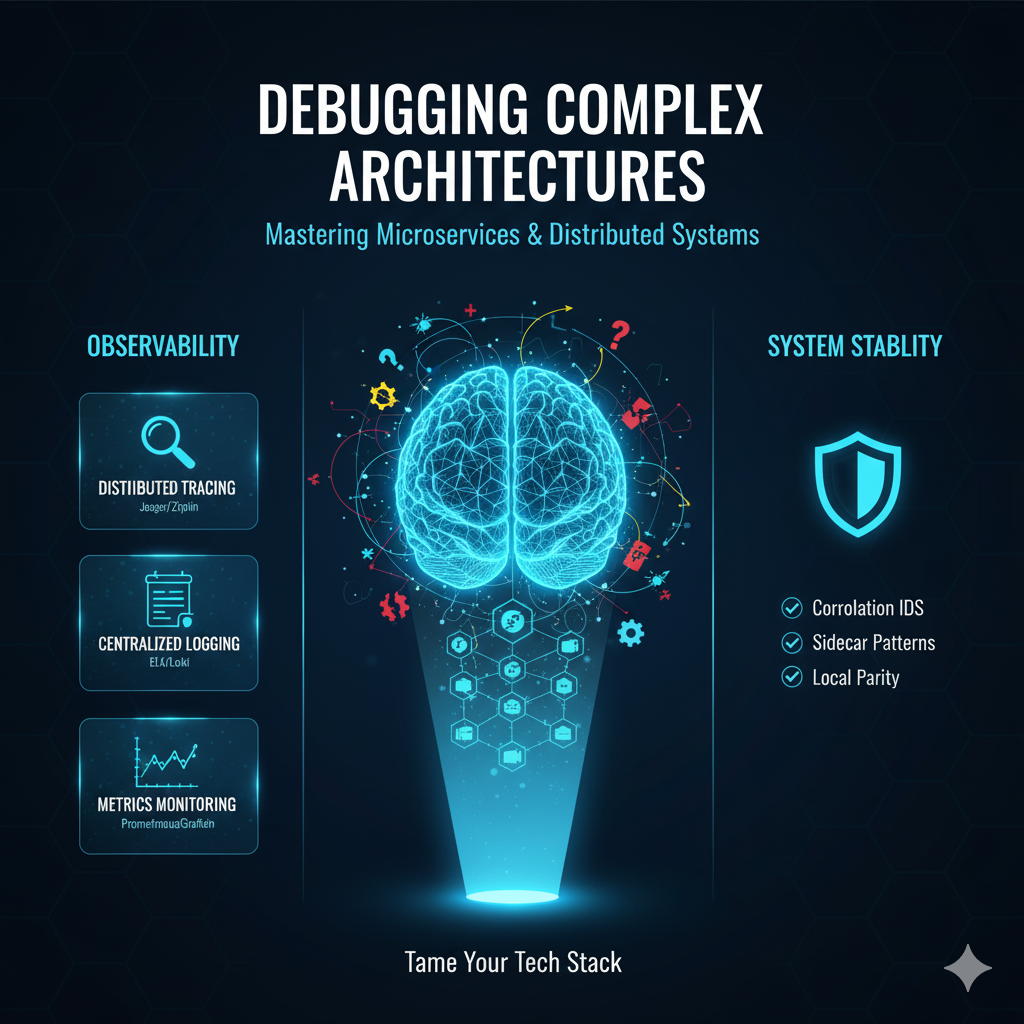
The Three Pillars of Observability: Your Debugging Foundation
The modern solution to debugging distributed systems is not to try and debug the code directly in production, but to instrument the code and infrastructure so that the system itself can tell you what is wrong.
This is achieved through the Three Pillars of Observability: Logs, Metrics, and Traces [7].
Pillar 1: Centralized Logging
In a containerized environment, logs must be treated as event streams, not as files on a disk.
Containers should write logs to standard output (stdout) and standard error (stderr), allowing the container runtime and orchestrator to capture them.
Structured Logging and Context
The most critical best practice is to adopt structured logging, typically in JSON format.
This makes logs machine-readable and easily searchable, allowing you to query for specific fields like user_id, service_name, or request_id.
Example of Structured Log Output:
{
  "timestamp": "2025-11-06T10:00:00Z",
  "level": "ERROR",
  "service": "user-auth-service",
  "message": "Failed to validate token",
  "request_id": "a1b2c3d4e5f6",
  "user_id": 12345,
  "error_code": 401
}
Centralized Logging Stacks
A centralized logging platform is non-negotiable.
The most common and robust solutions include:
| Stack | Components | Primary Use Case |
|---|---|---|
| ELK Stack | Elasticsearch, Logstash, Kibana | High-volume, full-text search and analysis of logs. |
| Loki Stack | Loki, Promtail, Grafana | Cost-effective, index-only-metadata approach, ideal for Kubernetes. |
| Splunk | Proprietary Indexer, Search Head | Enterprise-grade log management and security analytics. |
Pillar 2: Distributed Tracing
While logs tell you what happened inside a single service, distributed tracing tells you how a request flowed across all services.

It provides the crucial “global view” that is missing in microservices.
The Anatomy of a Trace
A trace is a record of the entire path of a request, composed of:
Trace ID: A unique identifier that is passed from the initial service to every subsequent service call.
Span ID: A unique identifier for a single operation within a service (e.g., a database query, an external API call).
Parent Span ID: Links a span to its parent operation, creating a hierarchical tree structure.
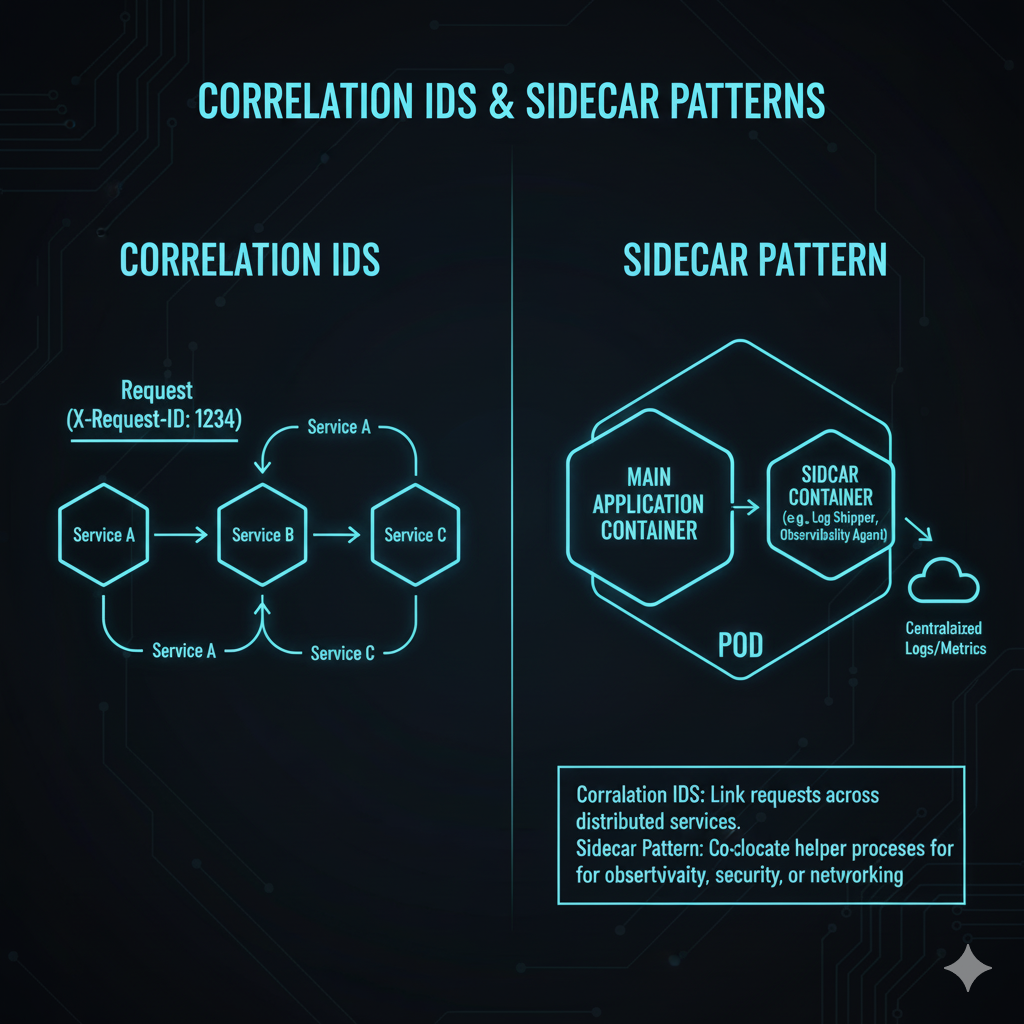
The key is the Correlation ID (which is often the Trace ID itself), which must be propagated across all network boundaries, including HTTP headers and message queue payloads [8].
Tracing Tools and Standards
The industry has largely converged on the OpenTelemetry (OTel) standard, which provides a vendor-agnostic way to instrument applications.
| Tool | Type | Key Feature |
|---|---|---|
| Jaeger | Open Source Tracing System | Excellent visualization of trace dependencies and latency. |
| Zipkin | Open Source Tracing System | Simple, lightweight, and widely adopted for basic tracing needs. |
| OpenTelemetry | Standard/SDK | A unified set of APIs, libraries, and agents to collect traces, metrics, and logs. |
Pillar 3: Advanced Metrics Monitoring
Metrics provide a numerical, time-series view of your system’s health, allowing you to detect anomalies and understand performance trends.
They answer the question: “Is the system working, and how well?”
The RED Method for Microservices
When defining metrics for microservices, the RED Method is a powerful framework [9]:
Rate: The number of requests, events, or transactions per second.
Errors: The number of failed requests per second (e.g., HTTP 5xx responses).
Duration: The time taken to process a request (latency), often measured using percentiles (e.g., p95, p99).
Metrics Stacks
The standard open-source stack for metrics is the combination of Prometheus and Grafana.
Prometheus: A time-series database and monitoring system that scrapes metrics endpoints (often exposed by a /metrics path on each service).
Grafana: A visualization and dashboarding tool that queries Prometheus to display the collected metrics in a meaningful way.
Strategic Debugging Techniques for Containerized Environments
With the observability foundation in place, specific techniques are required to leverage this data for effective debugging.
Technique 1: The Sidecar Pattern for Observability
In Kubernetes, the Sidecar Pattern is a game-changer for observability.
Instead of baking logging agents, tracing exporters, or metrics collectors into every service’s application code, you deploy them as a separate, dedicated container (the “sidecar”) within the same Kubernetes Pod [10].
This sidecar shares the network namespace and volume with the main application container, allowing it to:
Collect Logs: The sidecar can tail the main application’s log file (if it’s writing to a shared volume) or capture its stdout/stderr and forward it to the centralized logging system.
Handle Tracing: In a service mesh (like Istio or Linkerd), the sidecar intercepts all incoming and outgoing network traffic, automatically injecting and propagating trace headers without requiring application code changes.
Technique 2: Debugging with Kubernetes Tools
Kubernetes provides several native tools that are essential for container-level debugging.
kubectl logs and exec
The kubectl logs <pod-name> command is the first line of defense, allowing you to view the stdout/stderr of a running container.
For more interactive debugging, kubectl exec -it <pod-name> -- /bin/bash allows you to run a shell inside a running container, though this should be used sparingly and primarily for non-production environments due to the immutability principle [11].
The Ephemeral Container Feature
For production debugging, Kubernetes offers Ephemeral Containers (a feature in recent versions).
This allows you to inject a temporary container with debugging tools (like tcpdump or strace) into an existing Pod without restarting it or changing its configuration [12].
This adheres to the immutability principle while providing the necessary diagnostic access.
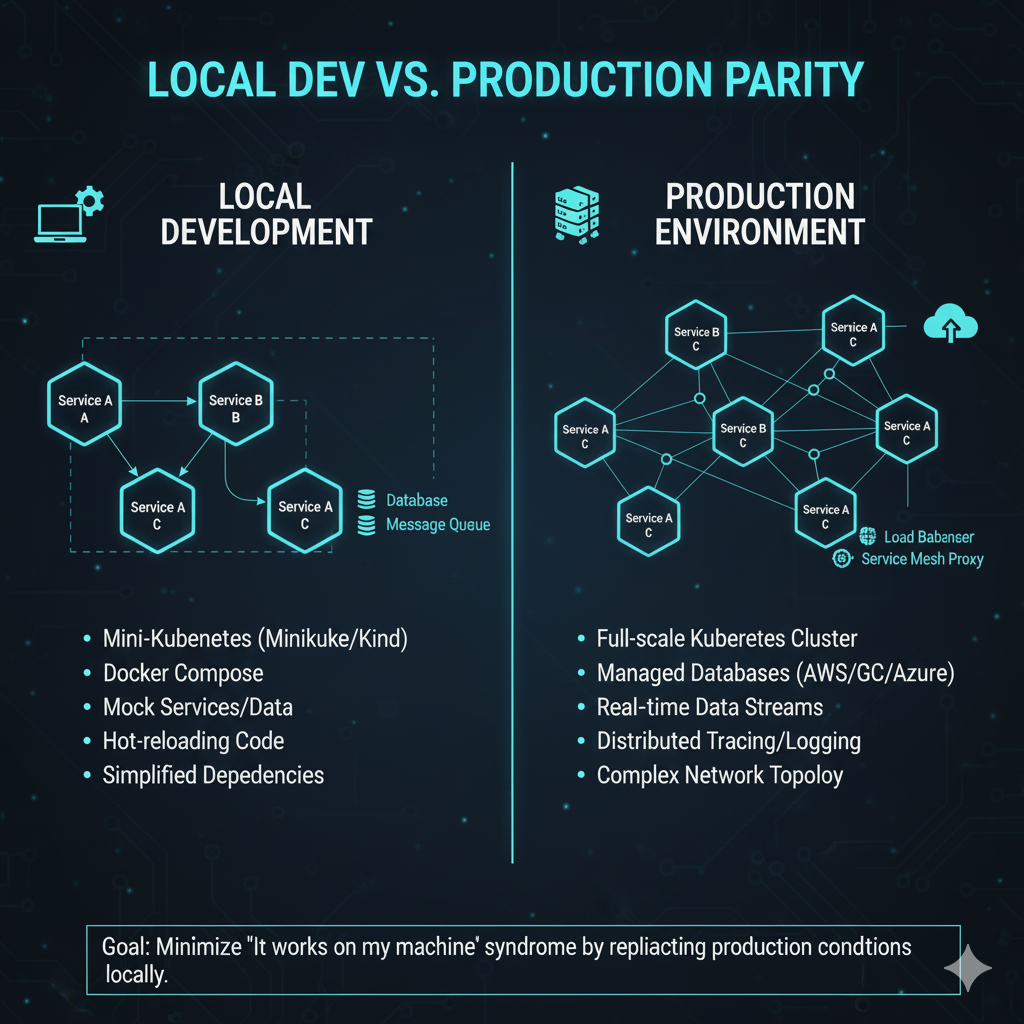
Technique 3: Local Development Mirroring
The most frustrating bugs are those that “only happen in production.”
To combat this, developers must strive to make their local development environment as close to production as possible.
Containerized Local Stack: Use Docker Compose or a local Kubernetes distribution (like Minikube or Kind) to run all dependent services (databases, message queues, other microservices) locally in containers.
Service Mesh Proxies: Tools like Telepresence or Bridge to Kubernetes allow a developer to run a single microservice locally while routing its traffic through the remote Kubernetes cluster’s service mesh, effectively debugging the service in the context of the live environment [13].
This technique, often called “traffic interception” or “remote debugging,” is vital for reproducing environment-specific bugs.
It works by installing a local agent that intercepts network traffic destined for the service in the cluster and redirects it to the developer’s local machine.
The local service can then be debugged using traditional IDE tools, all while interacting with the real-time services, databases, and message queues running in the remote cluster.
This eliminates the need to mock or simulate complex dependencies, which is a common source of “works on my machine” issues.
Furthermore, developers should invest in tools that allow for hot-reloading or live-reloading of code within the container.
This significantly speeds up the inner development loop, allowing for rapid iteration and testing of fixes without the lengthy process of rebuilding and redeploying the container image for every small change.
The goal is to reduce the friction between the development environment and the production environment to the absolute minimum.
‘}],path:
Advanced Strategies: Handling Inter-Service Communication Failures
Failures in microservices often stem from the communication layer.
Mastering the debugging of these interactions is crucial.
Strategy 1: Time Synchronization (NTP)
A seemingly simple but critical point: all services must have synchronized clocks using Network Time Protocol (NTP).
If clocks are out of sync, logs and traces from different services will have conflicting timestamps, making it impossible to reconstruct the sequence of events [14].
A difference of even a few seconds can render a distributed trace useless.
Strategy 2: The Circuit Breaker Pattern
When one service fails, it can quickly cascade into a failure of the entire system (a “death spiral”).
The Circuit Breaker Pattern is a design pattern that prevents this by wrapping calls to external services with a component that monitors for failures [15].
If the failure rate exceeds a threshold, the circuit “opens,” and subsequent calls fail immediately without waiting for a timeout, protecting the failing service and providing a fast-fail mechanism for the calling service.
Debugging a circuit breaker involves monitoring its state (Closed, Open, Half-Open) via metrics and ensuring the fallback logic is correctly logged.
Strategy 3: Request Payload Inspection
Often, the bug is not in the logic but in the data contract between services.
A service might send an unexpected null value, a malformed JSON object, or an outdated API version.
Tools that allow for payload inspection, such as network sniffers deployed via an ephemeral container or the detailed request/response logging provided by a service mesh, are invaluable for pinpointing these data-related issues [16].
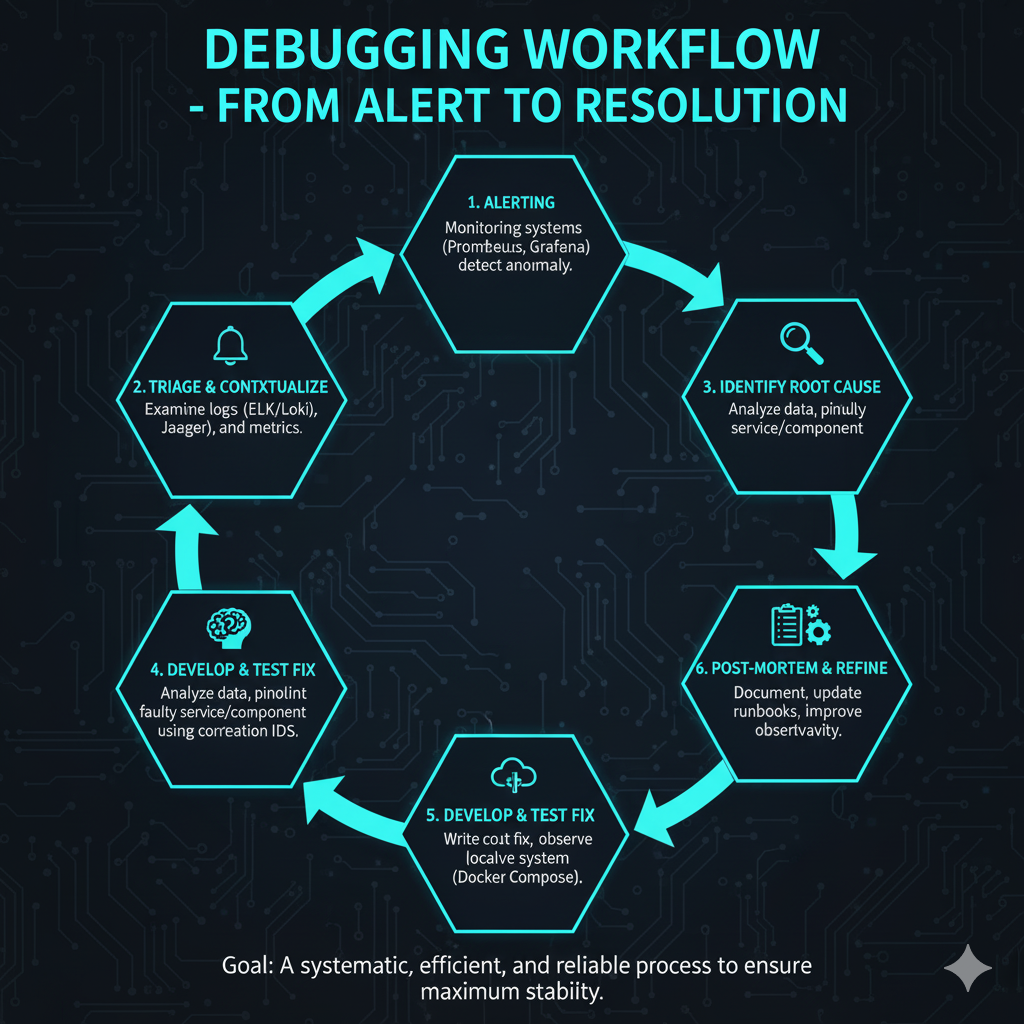
Checklist for Debugging a Microservices Incident
When an alert fires, a systematic approach is essential to avoid panic and ensure rapid resolution.
| Step | Action | Tool/Pillar |
|---|---|---|
| 1. Initial Triage | Check the RED metrics (Rate, Errors, Duration) for the affected service. Look for sudden drops in Rate or spikes in Errors/Duration. | Metrics (Prometheus/Grafana) |
| 2. Contextualize the Failure | Find a specific failed request using the metrics dashboard and obtain its Trace ID. | Metrics & Tracing Integration |
| 3. Trace Analysis | Use the Trace ID to view the full distributed trace. Identify the exact span (service operation) that failed or introduced excessive latency. | Tracing (Jaeger/Zipkin) |
| 4. Log Deep Dive | Filter the centralized logs using the Trace ID and the Service Name identified in the trace. Read the structured log messages for the root cause (e.g., database connection error, invalid input). | Logging (ELK/Loki) |
| 5. Infrastructure Check | If the logs are inconclusive, check the underlying container and node health (CPU, Memory, Disk I/O) using Kubernetes commands and infrastructure metrics. | Kubernetes (kubectl), Metrics |
| 6. Hypothesis & Fix | Formulate a hypothesis based on the combined data from all three pillars, implement the fix, and deploy it to a staging environment for validation. | Local Dev Environment |
Conclusion: Embracing Observability as a Culture
Debugging complex, containerized microservices is no longer a matter of attaching a debugger to a process.
It is a discipline rooted in observability, requiring a shift in culture and tooling.
By rigorously implementing centralized logging, distributed tracing, and advanced metrics monitoring, and by adopting strategic techniques like the sidecar pattern and ephemeral containers, development teams can transform their troubleshooting capabilities.
The complexity of the architecture is managed not by avoiding it, but by illuminating every corner of it, ensuring that even the most elusive bugs can be systematically identified and resolved [17].
References
[1] Microservices – Martin Fowler
[2] Debugging Microservices: The Ultimate Guide – Sayonetech
[3] Debug Problems in Microservices – Splunk
[4]