


The shift to cloud-native architectures—characterized by microservices, containers, and orchestration platforms like Kubernetes—has brought unprecedented agility and scalability.
However, it has also introduced a new level of complexity to operations.
Troubleshooting in these environments is no longer a linear process of checking a single server log.
It is a multi-dimensional challenge that requires a holistic understanding of distributed systems, a mastery of specialized tools, and a resilient mindset.
The ephemeral nature of containers, the dynamic networking of service meshes, and the sheer volume of telemetry data can quickly overwhelm even seasoned engineers.
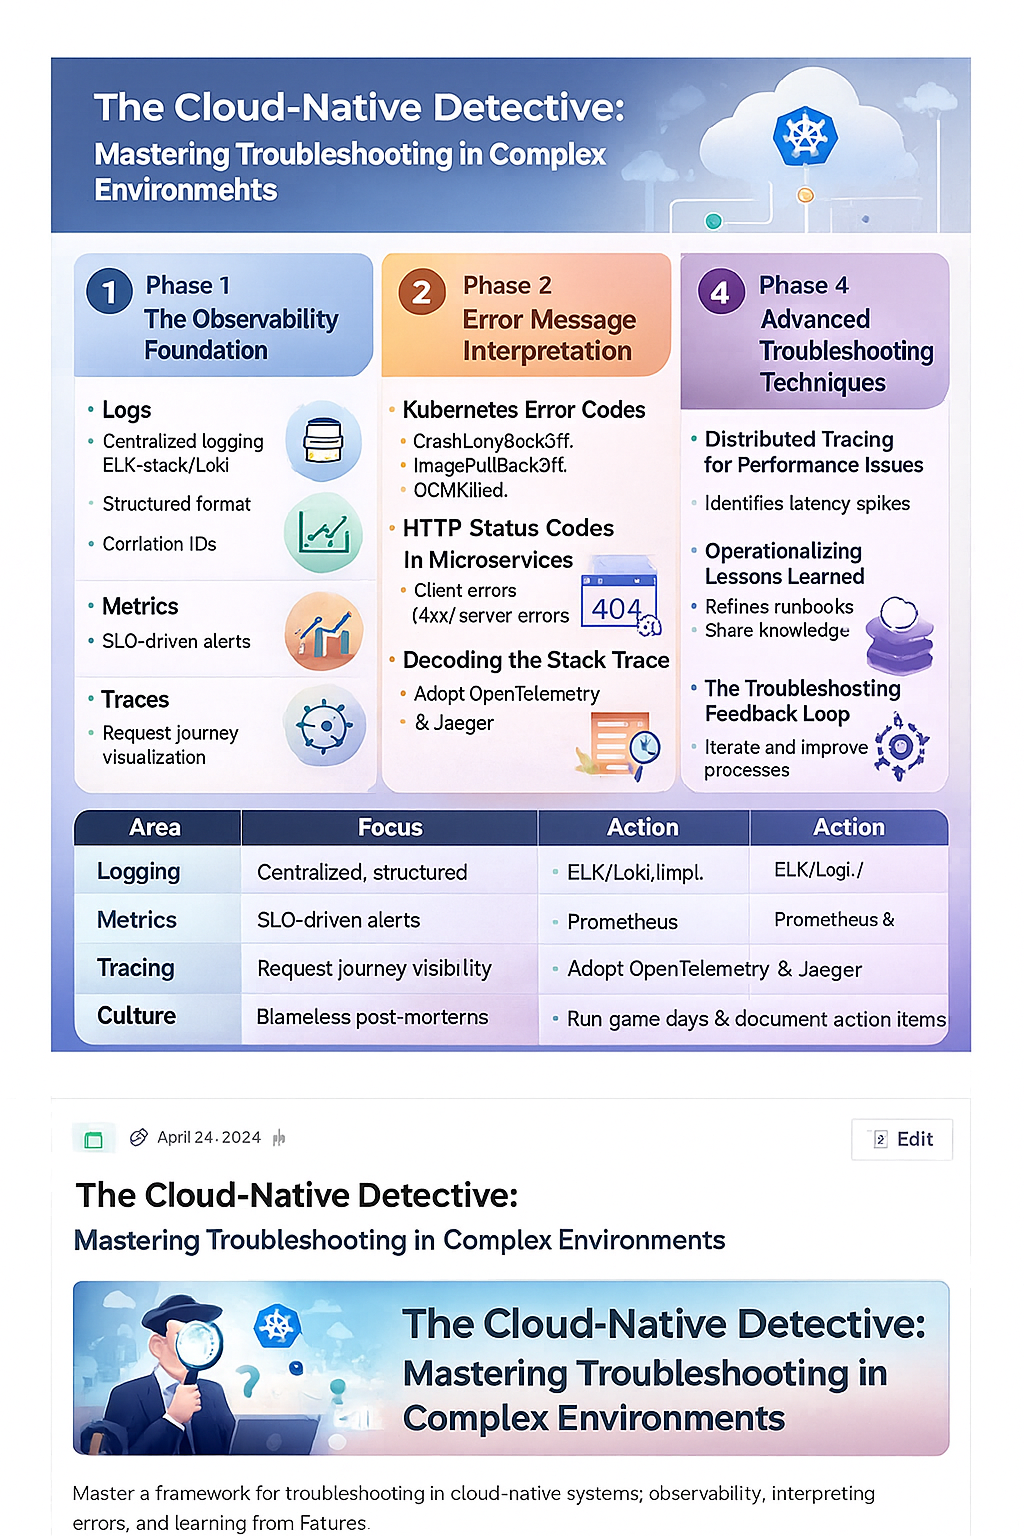
This guide provides a comprehensive framework for mastering troubleshooting in cloud-native environments, focusing on the critical skills of error message interpretation and learning from every failed attempt.
Phase 1: The Observability Foundation
Effective troubleshooting begins long before an incident occurs.
It starts with building a robust observability stack that provides the necessary context to understand system behavior.
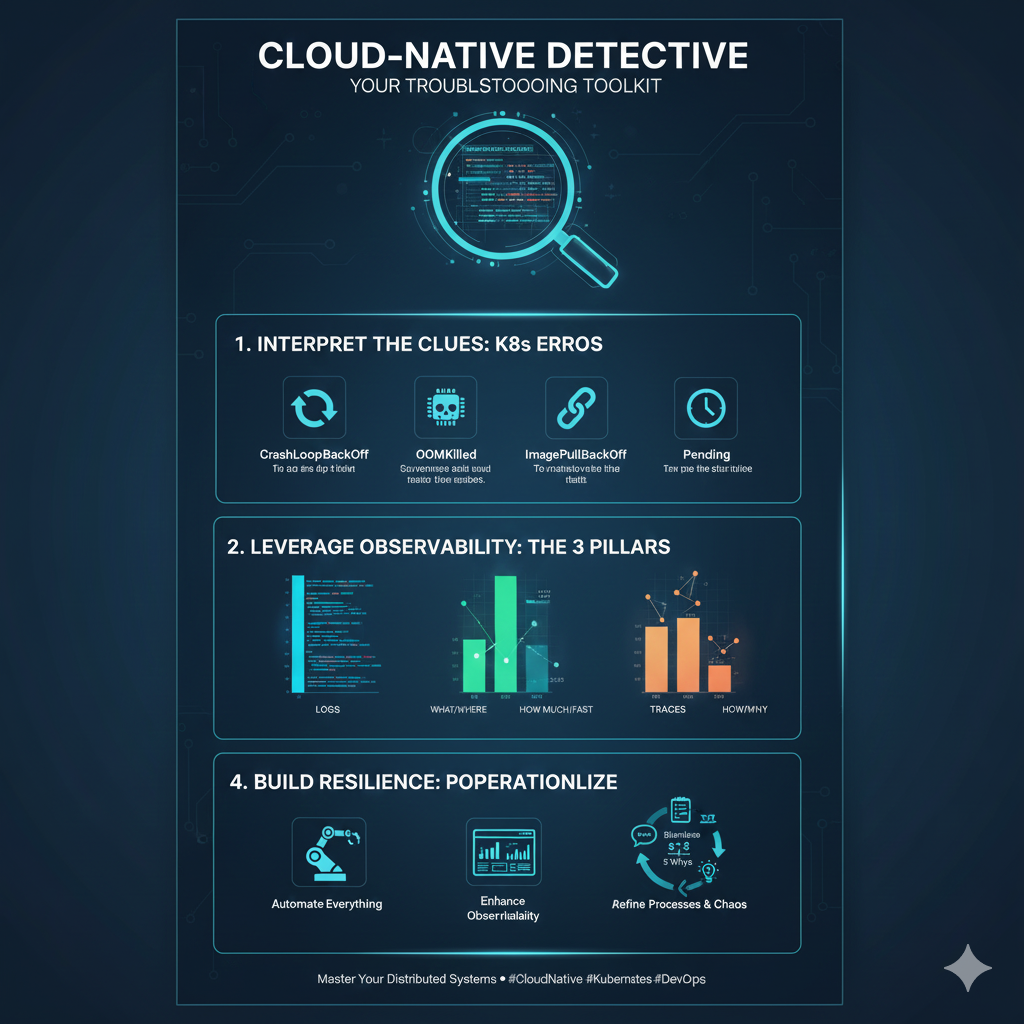
The traditional “three pillars” of observability—logs, metrics, and traces—are essential, but their implementation in a cloud-native context is specialized.
1. Logs: Centralization and Context
In a microservices architecture, a single user request can traverse dozens of services, each generating its own logs.
Relying on SSHing into individual containers is futile.
Centralized Logging
- Implement a centralized logging solution (e.g., ELK Stack, Grafana Loki) to aggregate logs from all containers, nodes, and infrastructure components.
- This provides a single pane of glass for all events.
Structured Logging
- Enforce structured logging (JSON format) across all services.
- This makes logs machine-readable and easily searchable by fields like
trace_id,service_name, andseverity.
Correlation IDs
- Ensure every request is tagged with a unique correlation ID (or trace ID) that is passed through all services.
- This is the key to stitching together the journey of a request across the distributed system.
2. Metrics: Health and Performance Indicators
Metrics provide the quantitative data needed to detect anomalies and understand performance bottlenecks.
The Four Golden Signals
- Monitor latency, traffic, errors, and saturation for every service.
- These signals provide a high-level view of service health and user experience.
Prometheus and Grafana
- Use Prometheus for time-series data collection and Grafana for visualization.
- Instrument your applications with client libraries to expose custom metrics that reflect business logic.
Alerting
- Configure alerts based on Service Level Objectives (SLOs) derived from your metrics.
- Alerts should be actionable, not merely informational, and should include context to aid in the initial triage.
3. Traces: The Request Journey
Distributed tracing is the most powerful tool for understanding the flow of a single request through a complex microservices graph.
OpenTelemetry
- Adopt OpenTelemetry (OTel) as the standard for instrumenting your code.
- OTel provides a vendor-agnostic way to generate, collect, and export traces.
Service Maps
- Use tracing tools (e.g., Jaeger, Zipkin) to visualize the service dependency map.
- This immediately highlights which service is causing latency or failure in a request chain.
Root Cause Analysis
- Traces allow you to pinpoint the exact span (function call or external service interaction) that introduced an error or significant delay, drastically reducing the time to root cause.
Phase 2: Error Message Interpretation
In a cloud-native environment, error messages are your primary source of intelligence.
They are often cryptic, multi-layered, and can originate from the application, the container runtime, the orchestrator, or the underlying cloud infrastructure.
Mastering their interpretation is a core troubleshooting skill.
4. Kubernetes Error Codes: The Orchestrator’s Language
Kubernetes is the heart of most cloud-native deployments, and its error messages are a frequent source of confusion.
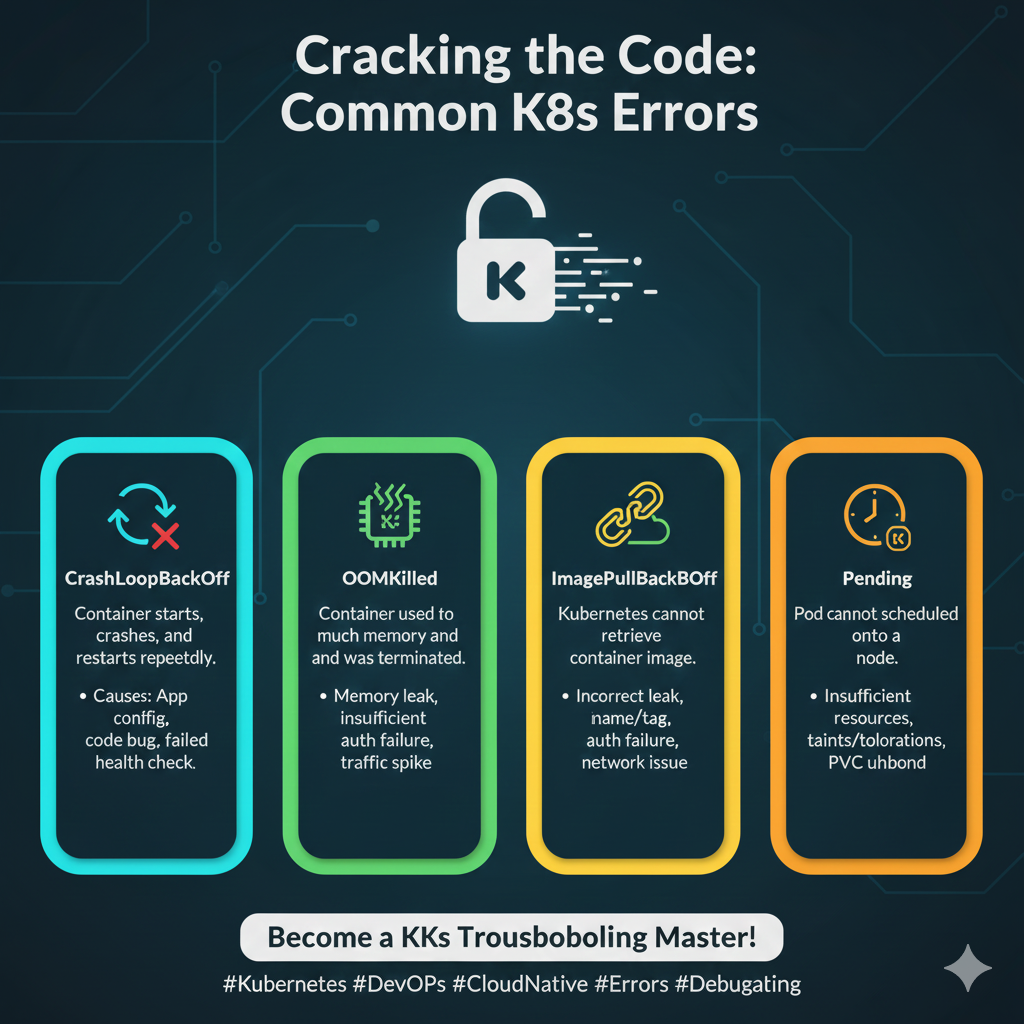
CrashLoopBackOff
- This is one of the most common and frustrating errors.
- It means a container is starting, crashing, and then restarting repeatedly.
- The root cause is almost always in the application code or configuration (e.g., failed health check, missing environment variable, unhandled exception).
- Interpretation: The application is fundamentally broken and cannot run.
- Action: Check the container logs (
kubectl logs <pod-name>) and the pod events (kubectl describe pod <pod-name>).
ImagePullBackOff
- The node cannot pull the container image.
- Interpretation: This is a supply chain or access issue.
- Action: Check the image name for typos, verify the image exists in the registry, and ensure the node has the correct credentials (ImagePullSecrets) to access the registry.
OOMKilled (Out of Memory Killed)
- The container exceeded its memory limit and was terminated by the kernel.
- Interpretation: The application is leaking memory or the resource limits are too low.
- Action: Increase the memory limit (
resources.limits.memory) or profile the application to find the memory leak.
5. HTTP Status Codes in Microservices
In a distributed system, an HTTP 500 error from a client-facing service often masks a deeper issue in a downstream service.
4xx vs. 5xx
- Clearly distinguish between client errors (4xx) and server errors (5xx).
- A 404 from a service might indicate a misconfigured route, while a 503 (Service Unavailable) often points to a readiness probe failure or a circuit breaker tripping.
Retry Logic
- Understand how error codes interact with your service mesh or API Gateway’s retry logic.
- A transient 503 might be automatically retried, but a persistent 400 should not.
Custom Error Payloads
- Enforce a standard, structured error payload (e.g., JSON with a unique error code and a human-readable message) across all microservices.
- This makes automated parsing and alerting much simpler.
6. Decoding the Stack Trace
A stack trace is a map of the execution path that led to an error.
In cloud-native environments, this trace is often incomplete or misleading due to asynchronous operations and service boundaries.
The “Boundary” Problem
- A stack trace only shows the execution within a single service.
- Use distributed tracing to connect the stack trace to the overall request flow.
Asynchronous Errors
- Be aware that errors in asynchronous workers or message queues (e.g., Kafka, RabbitMQ) may not immediately manifest in the user-facing service.
- You must trace the message ID to the worker’s logs to find the true source.
Contextual Logging
- Ensure your logging framework includes the necessary context (user ID, request ID, service version) in the stack trace to quickly reproduce the environment where the error occurred.
Phase 3: Learning from Failed Troubleshooting Attempts
The most valuable lessons in cloud-native operations come not from successful fixes, but from the attempts that failed.
Every dead end, every misdiagnosis, and every unnecessary rollback is a data point that can improve future incident response.
This requires a culture of blameless post-mortems and continuous process refinement.
7. The Blameless Post-Mortem Culture
A blameless culture is essential for psychological safety, which encourages engineers to report mistakes and share the full context of an incident without fear of punishment.
Focus on System, Not People
- The post-mortem should focus on “What allowed this to happen?” rather than “Who caused this?”
- Assume everyone involved was competent and acted with the best information they had at the time.
Detailed Timeline
- Create a meticulous, minute-by-minute timeline of the incident, including when alerts fired, when engineers joined, what actions were taken, and what the observed system response was.
- This reveals gaps in monitoring and communication.
Identify Contributing Factors
- Rarely is an incident caused by a single root cause.
- Identify all contributing factors: technical debt, poor documentation, lack of training, or a flawed deployment process.
8. Operationalizing Lessons Learned
A post-mortem is useless if its findings are not translated into concrete, measurable actions.
These actions are called Action Items or Preventative Measures.
SMART Action Items
- Ensure action items are Specific, Measurable, Achievable, Relevant, and Time-bound.
- Vague items like “Improve monitoring” are useless.
- Specific items like “Implement an alert for database connection pool saturation within 1 week” are actionable.
Process Refinement
- Use failed attempts to refine your runbooks and troubleshooting guides.
- If an engineer spent 30 minutes checking the wrong logs, update the runbook to prioritize the correct logs.
Knowledge Sharing
- Document the incident and its resolution in a centralized, searchable knowledge base (e.g., Confluence, internal wiki).
- This prevents the same mistake from being made by a different engineer in the future.
9. The Troubleshooting Feedback Loop
Treat troubleshooting itself as a process that needs continuous iteration.
The goal is to reduce Mean Time To Detect (MTTD) and Mean Time To Resolution (MTTR).
Simulate Failures
- Implement chaos engineering practices (e.g., using tools like Chaos Mesh or Gremlin) to proactively inject failures into your system.
- This tests your observability stack and your team’s response capabilities in a controlled environment.
Game Days
- Conduct regular “Game Days” where the team practices responding to simulated incidents.
- This builds muscle memory and identifies weaknesses in the troubleshooting process before they impact customers.
Automate Diagnostics
- Automate the initial diagnostic steps.
- For example, a failing pod alert should automatically trigger a script that gathers the pod’s logs, events, and a description of the node it was running on, and attaches this data to the incident ticket.
Phase 4: Advanced Troubleshooting Techniques
As systems mature, the problems become more subtle.
Advanced techniques are required to diagnose issues that are not immediately visible in logs or metrics.
10. Distributed Tracing for Performance Issues
While traces are excellent for finding errors, they are indispensable for diagnosing performance bottlenecks.
Latency Spikes
- Use traces to identify services that are experiencing unexpected latency spikes.
- A trace can show that a 500ms request is spending 450ms waiting for a single database query or an external API call.
Service Mesh Visibility
- Leverage the visibility provided by service meshes (e.g., Istio, Linkerd) to troubleshoot network-level issues like connection timeouts, retries, and load balancing problems without modifying application code.
11. The Power of kubectl and CLI Tools
Despite the complexity, the Kubernetes command-line tool (kubectl) remains the most powerful first-response tool.
kubectl describe
- This command is your best friend.
- It provides a wealth of information about a resource (Pod, Deployment, Service), including its status, events, resource limits, and conditions.
kubectl exec
- Use this sparingly, but it is necessary to enter a running container to check local files, network connectivity, or run diagnostic tools that are not exposed externally.
kubectl top
- Quickly check the resource consumption (CPU/Memory) of nodes and pods to identify resource hogs.
Conclusion: The Resilient Cloud-Native Engineer
Troubleshooting in cloud-native environments is a high-stakes, high-reward skill.
It demands a detective’s curiosity, a surgeon’s precision, and a philosopher’s acceptance of failure.
By establishing a strong observability foundation, mastering the interpretation of complex error messages, and cultivating a culture that learns aggressively from every failed attempt, you transform from a reactive firefighter into a proactive, resilient cloud-native engineer.
The complexity of modern systems is here to stay.
Your ability to navigate that complexity, to quickly diagnose the subtle interplay between microservices, and to continuously improve your operational processes is what defines excellence in the cloud-native era.
Embrace the challenge, and let every incident be a step toward a more robust and reliable system.
| Troubleshooting Phase | Key Practice | Tool/Mechanism |
|---|---|---|
| Observability Foundation | Centralized, Structured Logging | ELK/Loki, Correlation IDs |
| Observability Foundation | Distributed Tracing | OpenTelemetry, Jaeger/Zipkin |
| Error Interpretation | Kubernetes Error Decoding | kubectl describe, kubectl logs |
| Error Interpretation | Microservices Status Codes | 4xx vs 5xx, Custom Error Payloads |
| Learning from Failure | Blameless Post-Mortems | Detailed Timeline, Contributing Factors |
| Learning from Failure | Operationalizing Lessons | SMART Action Items, Runbook Refinement |
| Advanced Techniques | Proactive Failure Testing | Chaos Engineering, Game Days |