
and you’re left guessing what it’s trying to tell you? You’re not alone.
Modern operating systems are incredibly complex, and when things go wrong, pinpointing the exact cause can feel like searching for a needle in a digital haystack.
But what if I told you there’s a powerful, built-in tool that acts as your system’s diary, meticulously recording every significant event?
That tool is the Windows Event Viewer.
For many, the Event Viewer remains a mysterious corner of their operating system, often overlooked until a critical error brings it to the forefront.
However, this robust utility is an indispensable asset for anyone serious about understanding and maintaining their Windows environment.
Whether you’re a seasoned IT professional, a system administrator, or just a curious power user,
mastering the Event Viewer can dramatically improve your troubleshooting skills and help you identify the root causes of system instabilities, application crashes, security breaches, and performance bottlenecks.
In this comprehensive guide, we’ll embark on a journey to demystify the Windows Event Viewer.
We’ll move beyond the basics, exploring advanced techniques for navigation, filtering, and creating custom views that cut through the noise.
More importantly, we’ll delve into the art of interpreting critical event IDs, transforming cryptic numbers into actionable insights.
By the end of this post, you’ll be equipped with the knowledge to leverage Event Viewer as your primary diagnostic tool, turning system mysteries into solvable puzzles.
What is the Windows Event Viewer?
At its core, the Windows Event Viewer is a Microsoft Management Console (MMC) snap-in that allows you to view and analyze event logs on your local machine or a remote computer.
Think of it as a centralized repository where Windows records every significant occurrence, from system startups and shutdowns to application errors, security audits, and driver issues.
These events are categorized and logged with specific details, providing a chronological record of your system’s activities.
The Event Viewer presents these logs in a structured, readable format, making it easier to sift through potentially thousands of entries.
Without it, you’d be left sifting through raw, unformatted log files, a task that’s both tedious and inefficient.
It’s the CCTV monitoring system for your Windows OS, offering visibility features like zoom-in or high-definition clarity to discern critical events from routine occurrences.
The Core Event Logs
Windows categorizes events into several primary logs, each serving a distinct purpose:
Application Log: This log records events related to applications installed on your system.
This includes errors, warnings, and informational messages from programs like Microsoft Office, web browsers, or custom software.
If an application crashes or misbehaves, this is often the first place to look.
Security Log: This log is crucial for auditing security-related events.
It tracks successful and failed login attempts, resource access (e.g., file opens, printer usage), and changes to security policies.
It’s an essential tool for identifying potential security breaches or unauthorized activities.
System Log: This log contains events logged by Windows system components.
It records events like driver failures, hardware issues, system service startups/shutdowns, and other operating system-level messages.
Problems with hardware or core system services will typically appear here.
Setup Log: Events related to the installation or upgrade of the operating system, including Windows updates, are recorded in this log.
Forwarded Events: This special log stores events collected from other computers, typically in a networked environment, allowing for centralized log management.
Beyond these core logs, the Applications and Services Logs provide even more granular detail, often used by specific applications or services to log their own events.
These are invaluable for troubleshooting issues with particular software components.
Each event recorded in the Event Viewer comes with specific information that helps in diagnosis:
Event ID: A unique numerical identifier for each event type (e.g., Event ID 6008 for an unexpected system shutdown). This is your key to unlocking detailed information about the event.
Event Date and Time: Precisely when the event occurred, crucial for correlating events.
Source: The software, service, or component that generated the event (e.g., `Service Control Manager`, `Application Error`).
Log Name: The specific log where the event is recorded (e.g., Application, System, Security).
User: The user account associated with the event, if applicable.
Computer: The name of the computer where the event took place.
Level: Indicates the severity of the event: Information, Warning, Error, Critical, or Success Audit / Failure Audit (for security events).
These levels help you prioritize your investigation.
Understanding these fundamental components is the first step toward effective troubleshooting with Event Viewer.
How to Access and Navigate Event Viewer
Before we dive into the advanced stuff, let’s quickly recap how to get to Event Viewer.
There are a couple of straightforward ways:
Through the Start Menu: Type “Event Viewer” into the Windows search bar and select the application.
Using Run Command: Press `Windows key + R`, type `eventvwr.msc`, and press Enter.
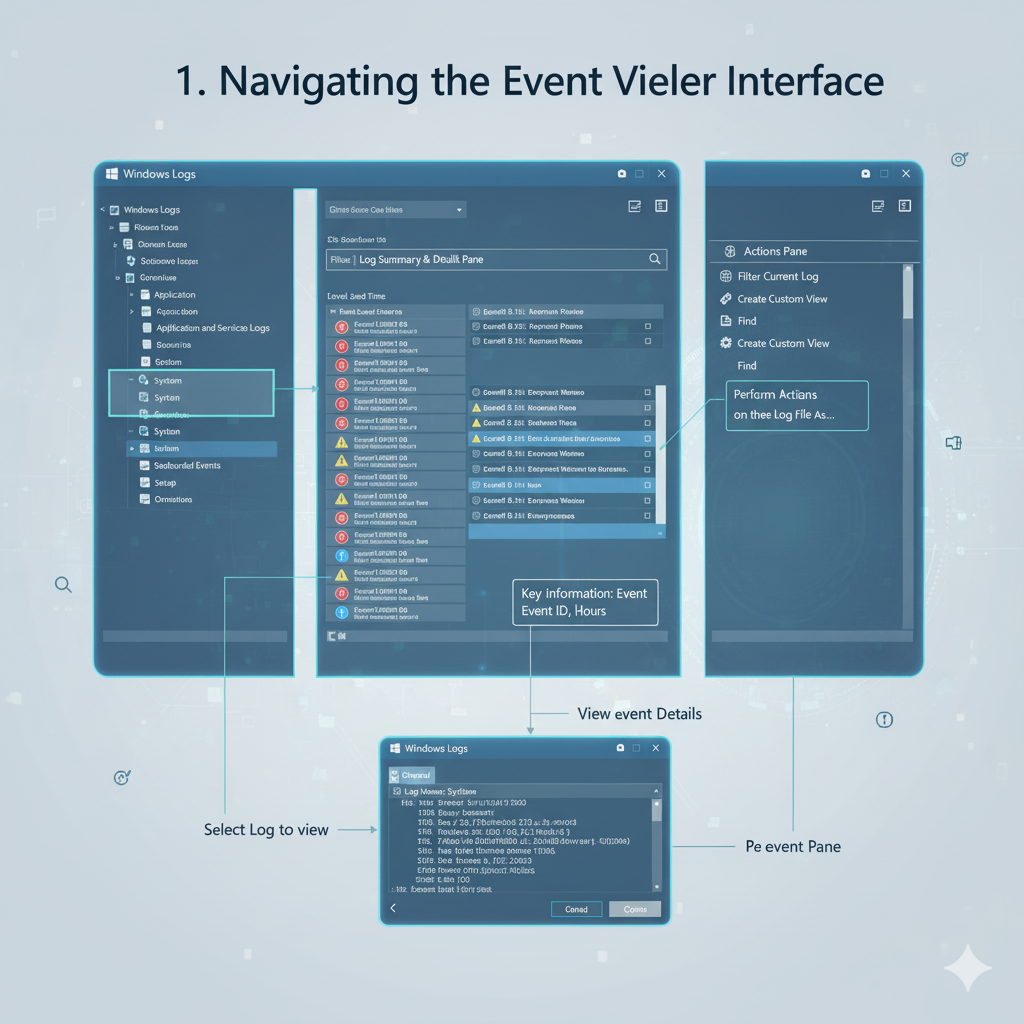
Once opened, you’ll see a console with a tree structure on the left.
This is where you’ll find the different log categories we just discussed.
The central pane displays the events, and the right-hand “Actions” pane provides quick links for common tasks.
Navigating through thousands of events can be daunting.
That’s why simply scrolling isn’t enough.
We need to employ more sophisticated methods to extract the relevant information.
Mastering Event Viewer: Advanced Filtering Techniques
This is where the real power of Event Viewer begins to shine.
Instead of sifting through endless entries, you can apply filters to narrow down the events to only those that are pertinent to your investigation.
This saves an immense amount of time and helps you focus on potential root causes.
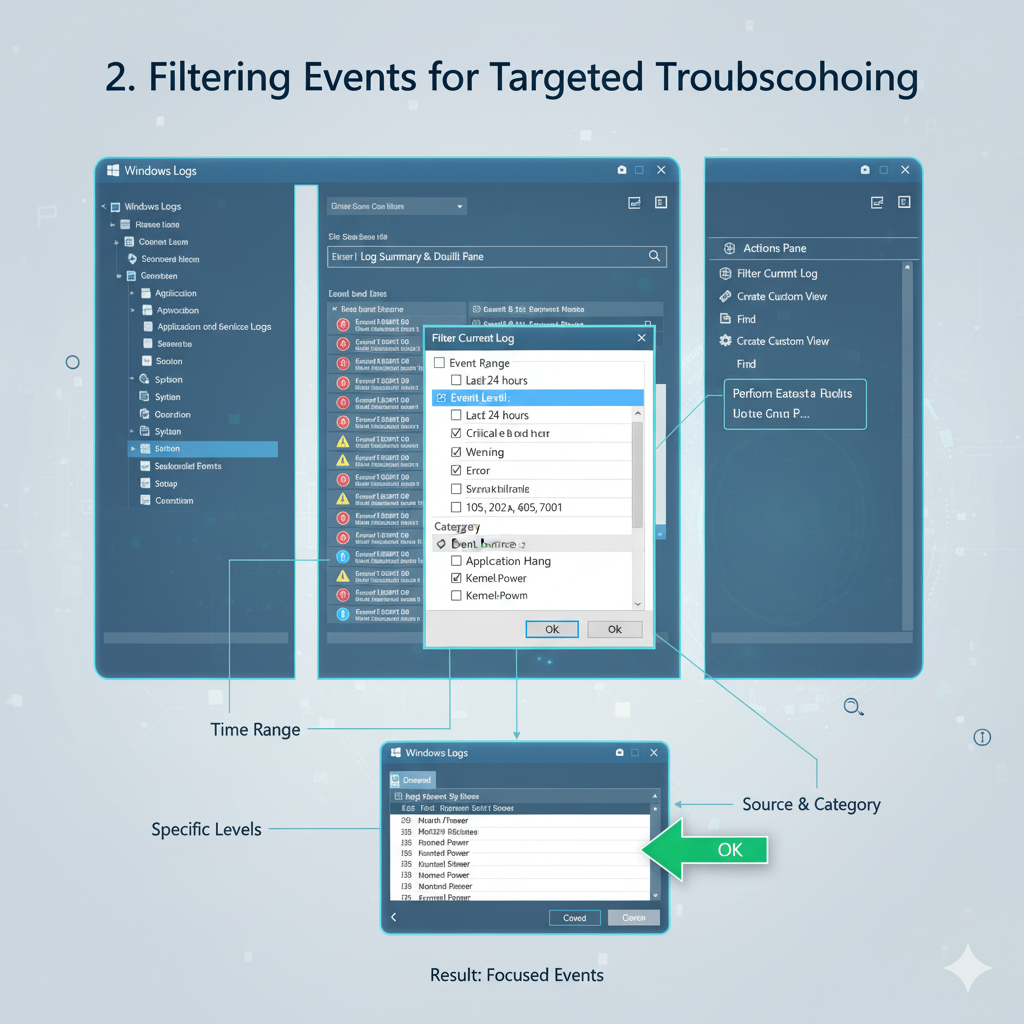
To apply a filter, select a log (e.g., “System”) and then click “Filter Current Log…” in the Actions pane on the right.
This opens a dialog box with several filtering options:
Logged: This allows you to specify a time range for the events.
If you know roughly when an issue occurred, this is incredibly useful. Options include “Last hour,” “Last 24 hours,” “Last 7 days,” or a custom range.
Event level: You can choose to display only Critical, Error, Warning, Information, or Audit events.
When troubleshooting a problem, you’ll often start by looking at Critical and Error events.
Event sources: Filter events generated by specific applications or system components.
For instance, if you suspect a problem with a particular service, you can select only its events.
Event IDs: If you know a specific Event ID related to your issue, you can enter it here. You can also specify a range of IDs or exclude certain IDs.
Keywords: Filter by predefined keywords associated with events.
User: Filter events related to a specific user account.
Computer(s): Useful in a networked environment to filter events from particular machines.
Let’s say your computer unexpectedly restarted last night.
You could go to the System log, filter by “Logged:
Last 24 hours” and “Event level: Critical, Error,” and then look for Event ID 6008 (unexpected shutdown) or other critical system errors that occurred around that time.
This targeted approach dramatically reduces the noise and helps you pinpoint the problem much faster.
Creating and Utilizing Custom Views
While filtering is powerful for one-off investigations, what if you frequently monitor for specific types of events?
This is where Custom Views become invaluable.
A custom view is essentially a saved filter that you can access with a single click, allowing you to quickly review recurring issues or monitor system health.
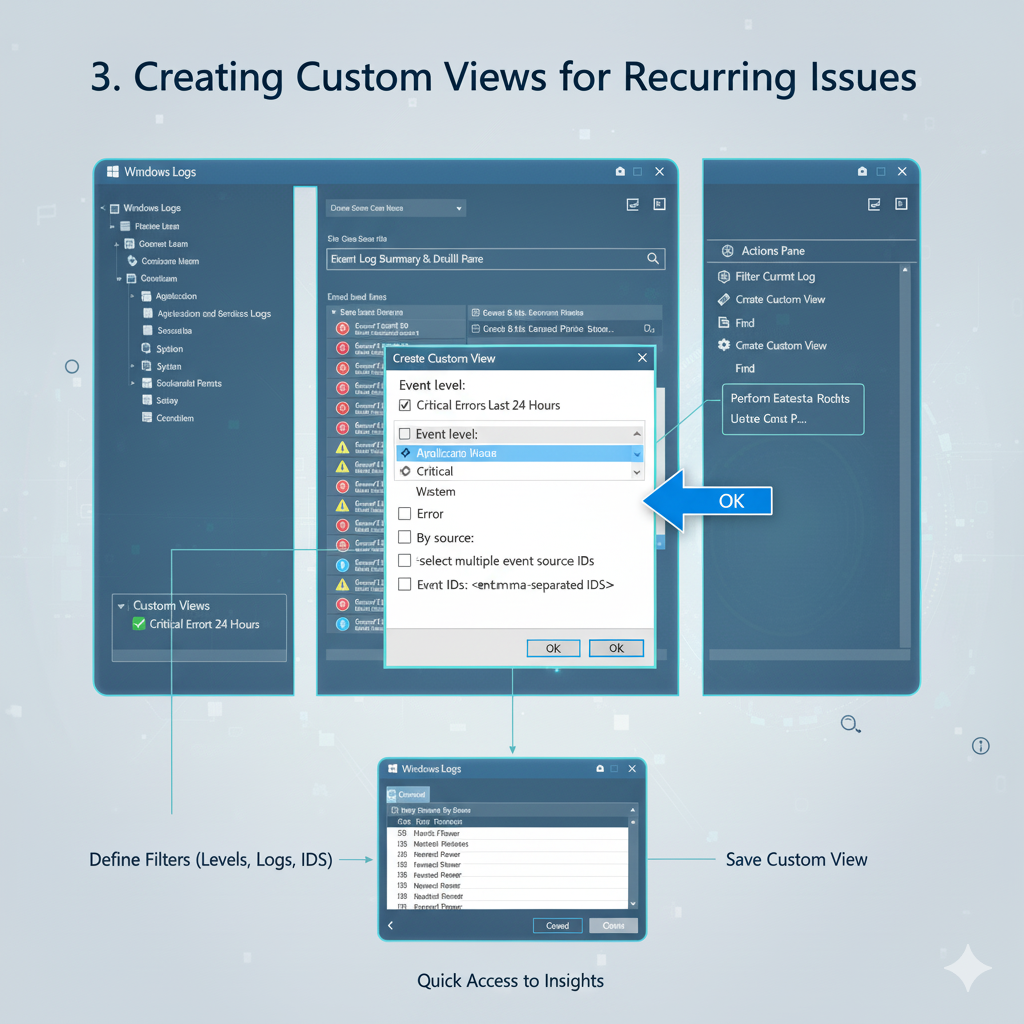
To create a custom view:
1. In the Actions pane, click “Create Custom View…”.
2. The “Create Custom View” dialog is similar to the “Filter Current Log” dialog, offering the same filtering options (time, event level, source, Event IDs, etc.).
3. Configure your desired filters. For example, you might create a view that shows all “Critical” and “Error” events from the “System” and “Application” logs over the last 7 days.
4. Once your filters are set, click “OK”.
5. You’ll be prompted to name your custom view and optionally add a description.
Choose a descriptive name like “Critical System Errors Last 7 Days.”
6. Your new custom view will appear under the “Custom Views” node in the left-hand tree pane.
Now, whenever you want to check for these specific events, you just click on your saved view.
Custom views are incredibly useful for:
Proactive Monitoring: Quickly check for critical errors or warnings that might indicate impending hardware failure or software issues.
Security Auditing: Create views to monitor failed login attempts (Event ID 4625) or changes to security policies.
Application-Specific Troubleshooting: If you manage a particular application, create a custom view to show only its errors and warnings.
Performance Baselines: Monitor specific informational events related to performance to establish a baseline and spot deviations.
You can even export and import custom views, making them shareable among IT teams or for use across multiple machines.
This standardization ensures consistent monitoring practices.
Interpreting Event IDs and Sources: Deciphering the Clues
This is arguably the most critical aspect of advanced Event Viewer usage.
An Event ID by itself is just a number.
Its true value comes from understanding what that number signifies in conjunction with its source and description.
Think of Event IDs as error codes, and the source as the component reporting the error.
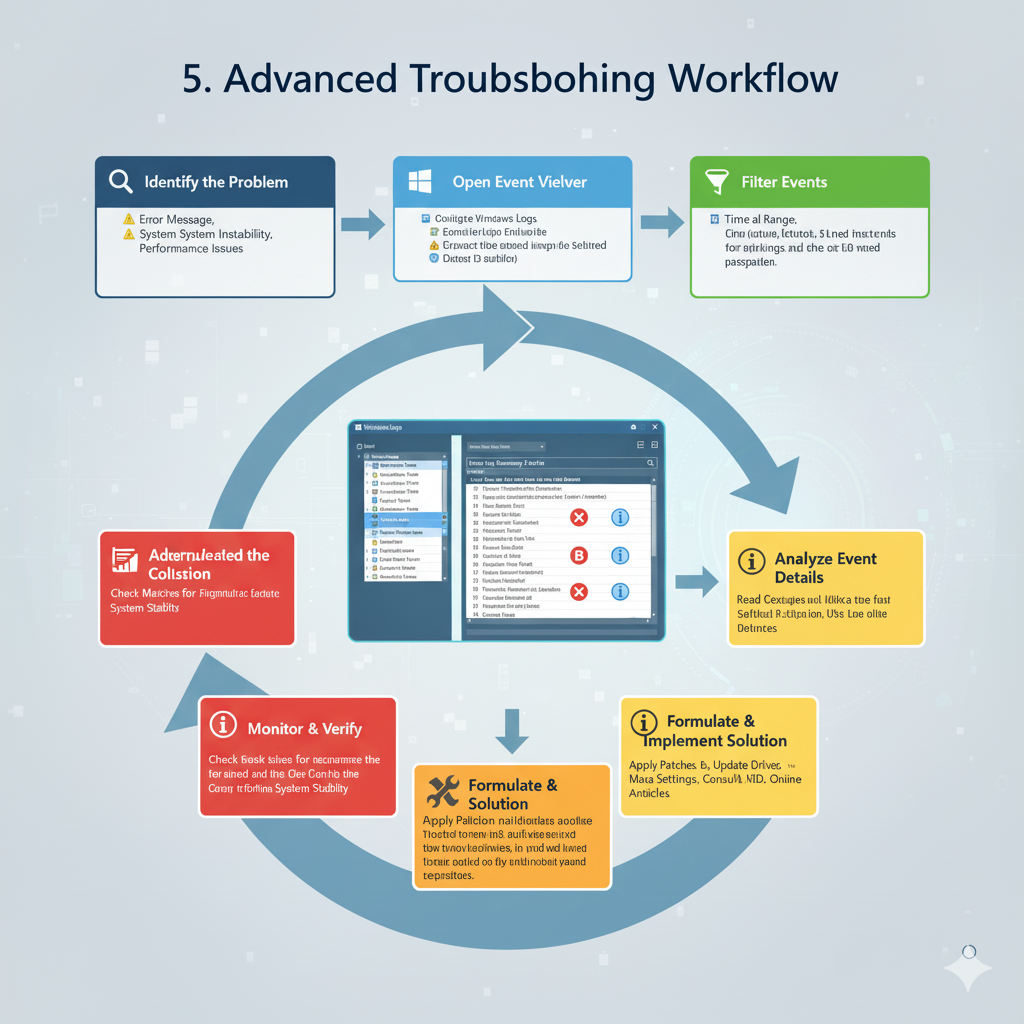
When you encounter a significant event (especially an Error or Critical one), here’s your troubleshooting workflow:
1. Note the Event ID and Source: These two pieces of information are your primary clues.
2. Read the General Tab: The “General” tab in the event properties window provides a human-readable description of the event. Sometimes, this description is enough to understand the problem and even suggests a solution.
3. Check the Details Tab: For more technical users, the “Details” tab offers raw data in XML or friendly view format. This can provide additional context, such as specific file paths, error codes, or process IDs.
4. Search Online: If the description isn’t clear, your next step is to search for the Event ID and Source together.
For example, “Event ID 41 Kernel-Power” or “Event ID 10016 DistributedCOM.”
Microsoft’s documentation (learn.microsoft.com) is an excellent resource,
often providing detailed explanations and troubleshooting steps for common Event IDs.
Third-party forums and knowledge bases are also valuable.
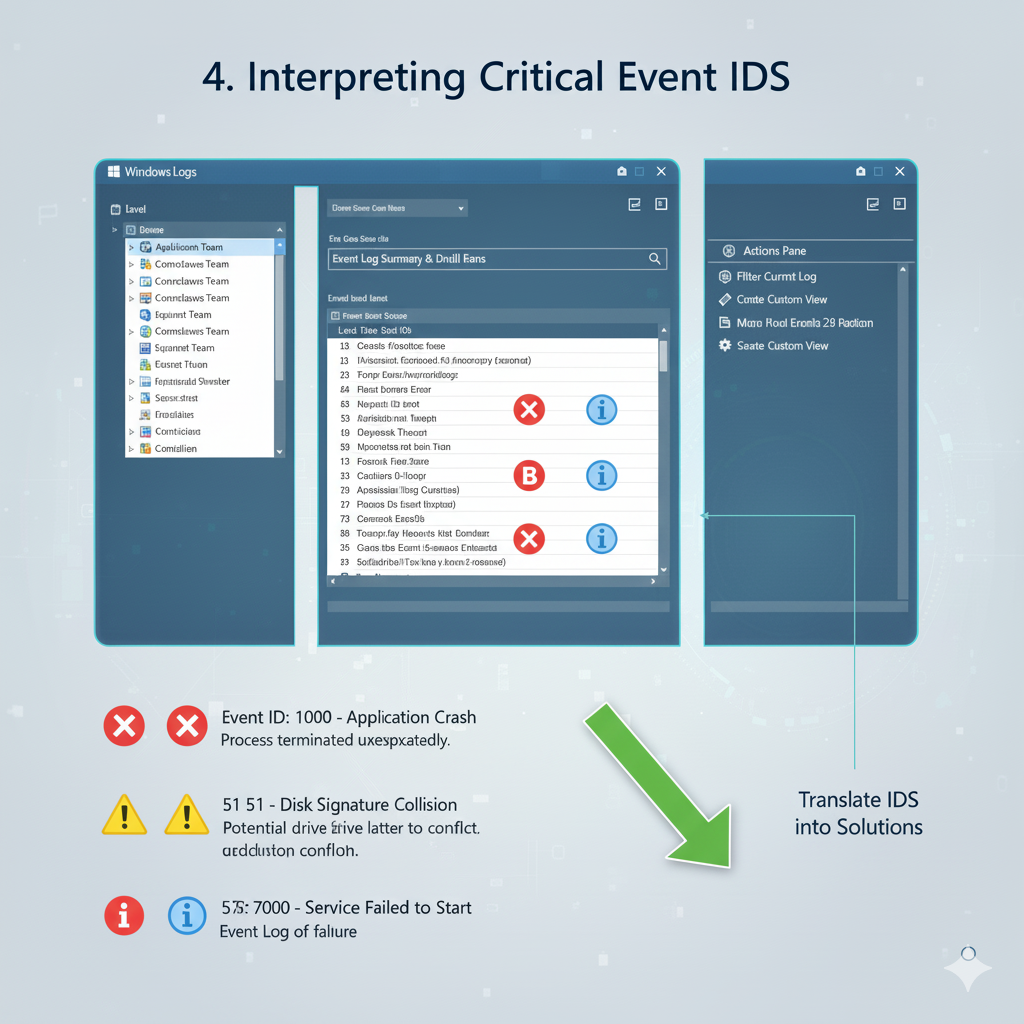
Common Critical Event IDs to Watch For
While there are thousands of Event IDs, some are particularly indicative of serious problems:
Event ID 41 (Kernel-Power): This often indicates an unexpected shutdown or restart.
It means the system rebooted without cleanly shutting down first, usually due to a power loss, system crash, or power supply issue.
Correlate this with other events around the same time to find the root cause.
Event ID 6008 (EventLog): Another indicator of an unclean shutdown. This event is logged when the system was shut down unexpectedly.
Event ID 10016 (DistributedCOM): Frequent occurrences of this warning/error often point to DCOM permission issues, which can lead to various application and system instabilities.
While often benign, persistent occurrences can cause problems.
Event ID 7000/7001/7009 (Service Control Manager): These relate to services failing to start, stopping unexpectedly, or timing out. The event description will usually name the problematic service.
Event ID 4625 (Microsoft Windows security auditing.): A failed logon attempt. Multiple occurrences from the same source or user could indicate a brute-force attack or incorrect credentials.
Event ID 4624 (Microsoft Windows security auditing.): A successful logon. While not an error, monitoring these can help track user activity and detect unusual access patterns.
Event ID 1000 (Application Error): A generic application crash.
The details will often point to the faulting application name, module, and offset, which are crucial for further investigation.
Remember, context is king.
A single error event might be an isolated glitch, but a pattern of recurring errors or a cluster of different critical events around the same time strongly suggests a systemic problem.
Always look at the events leading up to and immediately following a critical incident.
Common Troubleshooting Scenarios with Event Viewer
Let’s put our knowledge into practice with a few common scenarios:
Scenario 1: Random System Crashes (Blue Screen of Death – BSOD)
When your system experiences a BSOD, Event Viewer is your best friend. After the system restarts:
1. Open Event Viewer.
2. Navigate to Windows Logs > System.
3. Filter the current log for Critical and Error events within the time frame of the crash.
4. Look for Event ID 41 (Kernel-Power). This confirms an unexpected shutdown.
Now, look for other Error or Critical events just before Event ID 41.
These might include `BugCheck` events (Source: `System`), which provide a stop code (e.g., 0x00000124 for hardware errors), or driver-related errors.
5. Search online for the specific stop code or driver error message to identify the faulty component (hardware, driver, or software).
Scenario 2: Application Freezing or Crashing
If a specific application is misbehaving:
1. Open Event Viewer.
2. Navigate to Windows Logs > Application.
3. Filter the current log for Error events, and specify the application’s name as the Event source (if known).
4. Look for Event ID 1000 (Application Error) or other errors related to the application.
The description will often name the faulting module (e.g., a DLL file) and potentially a faulting offset.
This information is critical for developers or for finding specific patches/updates.
5. Also check the System log around the same time for any underlying system issues that might be affecting the application.
Scenario 3: Failed Login Attempts or Security Concerns
To investigate security-related issues:
1. Open Event Viewer.
2. Navigate to Windows Logs > Security.
3. Filter for Event ID 4625 (Audit Failure) for failed login attempts.
You can see the account name, source network address, and reason for failure.
4. Filter for Event ID 4624 (Audit Success) to track successful logins, especially if you suspect unauthorized access.
5. Look for other security-related events like changes to security groups (Event ID 4732/4733) or object access failures (Event ID 4656).
Best Practices for Event Viewer Usage
To get the most out of Event Viewer, consider these best practices:
Regular Review: Don’t wait for a problem to occur. Periodically review your custom views for critical errors or warnings to catch issues early.
Context is Key: Always look at events in context. A single error might be harmless, but a series of errors or errors correlated with other system behavior are more significant.
Document Findings: When you solve a problem using Event Viewer, document the Event IDs, sources, and resolutions. This creates a knowledge base for future troubleshooting.
Clear Logs (with caution): While generally not recommended for system logs, clearing application-specific logs can sometimes help you get a fresh start when troubleshooting a persistent issue,
making it easier to spot new errors. Always back up important logs before clearing.
Utilize Task Scheduler: You can configure Task Scheduler to trigger actions (like sending an email or running a script) when specific Event IDs are logged. This allows for automated alerting for critical issues.
Centralized Logging: For environments with multiple computers, consider centralized logging solutions (like Windows Event Forwarding or third-party SIEM tools) that aggregate logs from many machines, making large-scale troubleshooting and security monitoring much more efficient.
Conclusion
The Windows Event Viewer is far more than just a passive log viewer; it’s a dynamic and powerful diagnostic tool that, when wielded effectively, can transform your approach to Windows troubleshooting.
By understanding its structure, mastering filtering and custom views, and learning to interpret the cryptic language of Event IDs, you gain unparalleled insight into the health and behavior of your system.
From pinpointing the cause of elusive system crashes to tracking down application failures and identifying security anomalies, Event Viewer provides the evidence you need to move from guesswork to informed solutions.
It empowers you to become a digital detective, piecing together clues to uncover the root causes of even the most perplexing Windows problems.
So, the next time your Windows system starts acting up, don’t panic. Open the Event Viewer, put on your detective hat, and
let the logs guide you to the solution. Happy troubleshooting!