

In the fast-paced world of web development, building robust and high-performing applications is paramount.
As applications grow in complexity, so does the challenge of identifying and resolving issues.
While `console.log` has been a trusty companion for many developers, modern web applications demand a more sophisticated approach to debugging.
It’s time to move beyond the basics and embrace advanced techniques that can significantly streamline your development workflow and enhance the quality of your code. [1, 2]
Debugging isn’t just about fixing bugs; it’s about understanding the intricate dance of your code, pinpointing performance bottlenecks, and ensuring a seamless user experience.
In this comprehensive guide, we’ll delve into a range of advanced debugging techniques and tools that empower you to tackle even the most elusive issues in modern web applications. [3]
Whether you’re a seasoned developer looking to refine your skills or an aspiring engineer eager to master the art of debugging,
this post will equip you with the knowledge and strategies to become a debugging pro.
Let’s dive in
Leveraging Browser Developer Tools: Your First Line of Defense
Modern web browsers come equipped with powerful developer tools that are indispensable for debugging.
While many developers are familiar with the basics, truly mastering these tools can unlock a new level of debugging efficiency. [1, 2]
The Elements Panel: Inspecting and Manipulating the DOM
The Elements panel is your window into the Document Object Model (DOM) and the CSS rules that govern your web application’s appearance.
It allows you to inspect, modify, and even create HTML and CSS on the fly, providing immediate visual feedback. [1]
Live Editing: You can directly edit HTML attributes, text content, and CSS properties within the Elements panel.
This is incredibly useful for testing quick style changes or layout adjustments without touching your source code.
For instance,
if you want to see how a button looks with a different background color,
you can simply change the `background-color` property in the Styles pane and observe the change instantly. [1]
CSS Grid and Flexbox Debugging: For complex layouts, the Elements panel offers dedicated tools to visualize and debug CSS Grid and Flexbox containers.
These overlays help you understand how elements are aligned, spaced, and resized, making it easier to identify and fix layout issues. [2]
Event Listeners: Ever wondered why a certain click event isn’t firing?
The Elements panel allows you to inspect event listeners attached to any DOM element, helping you trace event propagation and identify potential conflicts or missing handlers.
Videos are added as random thoughts 💭 💭 💭….
The Console Panel: Logging, Interacting, and Executing JavaScript
The Console panel is more than just a place for `console.log` statements.
It’s a powerful command-line interface for your web page, allowing you to execute JavaScript, inspect variables, and monitor network activity. [1]
Structured Logging: Beyond `console.log`, leverage `console.warn`, `console.error`, `console.info`, and `console.table` for more organized and informative output.
`console.table` is particularly useful for displaying array or object data in a readable tabular format. [1]
Interactive JavaScript Execution: You can type and execute JavaScript code directly in the console, making it an excellent environment for testing small snippets, manipulating the DOM, or inspecting the current state of your application. [1]
Network Activity Monitoring: While there’s a dedicated Network panel, the Console can also display network requests and responses,
especially useful for quickly spotting failed API calls or unexpected data. [1]
The Sources Panel: Deep Dive into JavaScript Debugging
The Sources panel is where serious JavaScript debugging happens.
It provides a comprehensive environment for setting breakpoints, stepping through code, and analyzing the call stack. [2]
Breakpoints: Set breakpoints to pause code execution at specific lines.
This allows you to inspect the application’s state at that exact moment, examine variable values, and understand the flow of execution.
Conditional breakpoints, which only trigger when a certain condition is met, are invaluable for narrowing down issues in large codebases. [2]
Watch Expressions: Keep an eye on specific variables or expressions by adding them to the Watch panel.
This allows you to see how their values change as you step through your code, providing crucial insights into data transformations. [2]
Call Stack Analysis: The Call Stack pane shows the sequence of function calls that led to the current execution point.
This is particularly helpful for understanding how different parts of your application interact and for debugging asynchronous code. [2]
Source Maps: When working with minified or transpiled JavaScript (e.g., from Webpack or Babel), source maps are essential.
They map your compiled code back to your original source files, making debugging a much more human-readable experience.
Ensure your build process generates and correctly configures source maps. [1]
The Network Panel: Analyzing Data Flow and Performance
The Network panel is crucial for understanding how your application communicates with servers and external resources.
It provides a detailed breakdown of every network request and response. [1]
Request Details: Inspect headers, payload, preview, and response for each request.
This helps you verify that data is being sent and received correctly and identify issues with API endpoints or data formatting. [1]
Performance Metrics: Analyze the timing of each request, including DNS lookup, initial connection, SSL handshake, and content download.
This helps pinpoint slow network requests that might be impacting your application’s performance. [2]
Throttling Network Speed: Simulate different network conditions (e.g., 3G, offline) to test how your application behaves under varying connectivity.
This is vital for ensuring a smooth user experience for users with limited bandwidth. [2]
Blocking Requests: Temporarily block specific network requests to see how your application responds when certain resources are unavailable.
This is useful for testing fallback mechanisms or identifying dependencies. [2]
The Performance Panel: Identifying Bottlenecks
The Performance panel (formerly Timeline) allows you to record and analyze the runtime performance of your web application.
It provides a visual representation of CPU usage, network activity, rendering, and JavaScript execution. [1]
CPU Profiling: Identify which functions or operations consume the most CPU time. This helps you pinpoint performance bottlenecks in your JavaScript code. [2]
Frame Analysis: Observe frame rates and identify dropped frames, which can indicate jank or unresponsiveness in your UI. [2]
Memory Leaks: While there’s a dedicated Memory panel, the Performance panel can also provide hints about increasing memory usage over time,
which might indicate a memory leak. [1]
The Memory Panel: Hunting Down Memory Leaks
Memory leaks can severely degrade application performance and even lead to crashes.
The Memory panel is your primary tool for detecting and diagnosing these elusive issues. [1]
Heap Snapshots: Take snapshots of your application’s JavaScript heap to analyze memory usage at different points in time.
Comparing snapshots can help you identify objects that are being retained unnecessarily, indicating a memory leak. [1]
Allocation Profiler: Record memory allocations over time to see where memory is being allocated and if it’s being properly released. [1]
The Application Panel: Managing Storage and Offline Data
The Application panel provides insights into various storage mechanisms used by your web application, including Local Storage, Session Storage, IndexedDB, and Cookies.
It’s also where you manage Service Workers and Cache Storage for offline capabilities. [1]
Data Inspection and Modification: Easily inspect, modify, or delete data stored in Local Storage, Session Storage, and Cookies.
This is useful for testing different application states or debugging data persistence issues. [1]
Service Worker Debugging: Register, unregister, and update Service Workers, and inspect their lifecycle events.
This is crucial for debugging progressive web applications (PWAs) and offline functionality. [1]
Lighthouse: Auditing for Quality
Lighthouse is an open-source, automated tool for improving the quality of web pages.
It provides audits for performance, accessibility, best practices, SEO, and Progressive Web Apps.
While not strictly a debugging tool in the traditional sense, its comprehensive reports can highlight areas that might be causing subtle bugs or performance issues. [1]
Performance Scores: Get actionable insights into your page’s loading performance, identifying opportunities for optimization. [1]
Accessibility Checks: Ensure your application is usable by everyone, including users with disabilities, by identifying common accessibility pitfalls. [1]
Mobile Device Emulation: Responsive Design Debugging
Modern web applications must be responsive and work seamlessly across various devices.
The device emulation mode in your browser’s developer tools allows you to simulate different screen sizes, resolutions, and device types. [1]
Viewport Resizing: Quickly test how your layout adapts to different screen dimensions. [1]
Device Presets: Emulate specific mobile devices, including their user agents and touch events. [1]
Network Throttling: Combine device emulation with network throttling to test performance on mobile networks. [2]
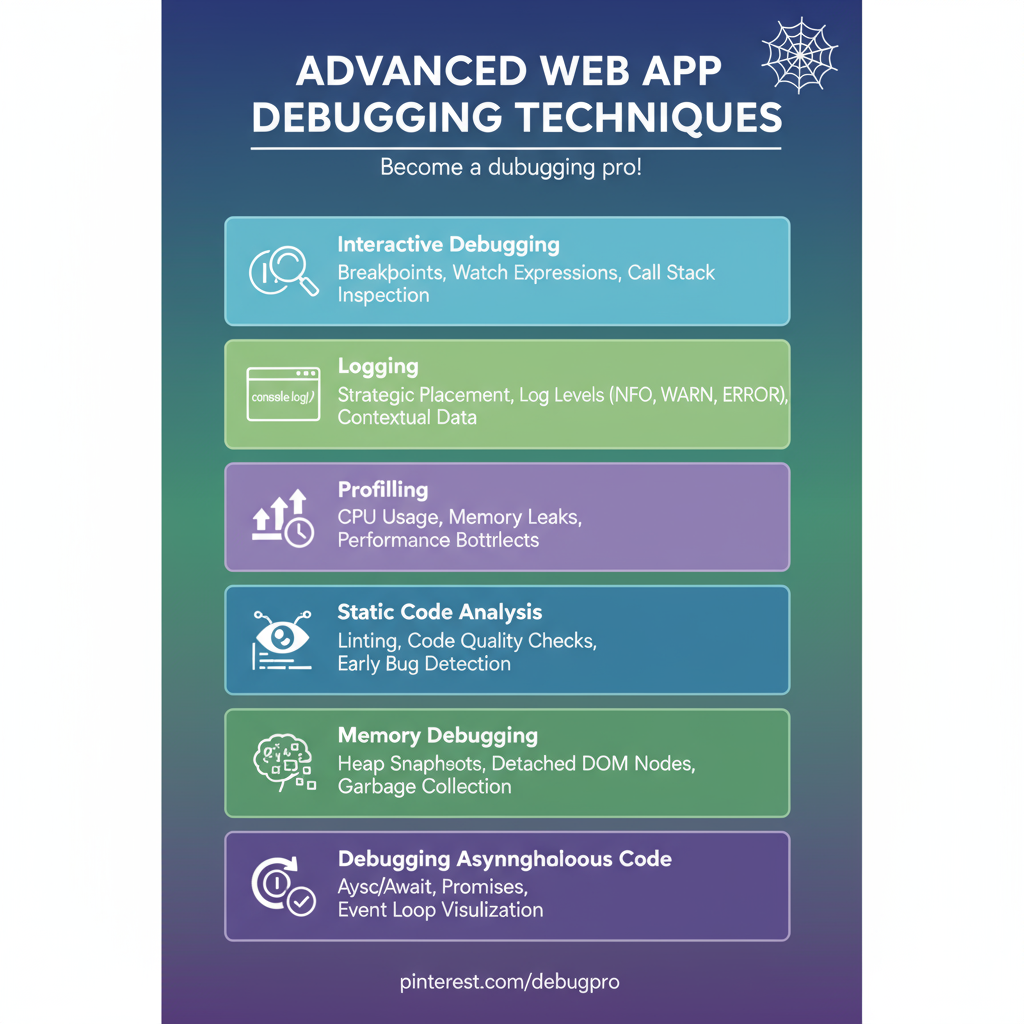
Beyond the Browser: Advanced Debugging Techniques
While browser developer tools are incredibly powerful for frontend debugging, modern web applications often involve complex backend logic, intricate data flows, and asynchronous operations that require a broader set of debugging techniques.
Let’s explore some of these advanced methods that transcend the browser environment. [3]
Interactive Debugging: Stepping Through Your Code
Interactive debugging, often facilitated by Integrated Development Environments (IDEs) or specialized debuggers, allows you to pause the execution of your application at any point and inspect its state in real-time.
This is a fundamental technique that goes beyond simple `console.log` statements. [3]
Breakpoints: As mentioned with browser DevTools, breakpoints are crucial. In an IDE, you can set breakpoints directly in your source code.
When the execution reaches a breakpoint, it pauses, allowing you to examine variable values, the call stack, and the program’s flow.
Conditional breakpoints, which activate only when a specific condition is met, are invaluable for isolating issues in loops or complex functions. [3]
Watch Expressions: Similar to browser DevTools, you can add variables or expressions to a ‘watch’ window.
This provides a live view of their values as you step through your code, helping you understand how data transforms and flows through your application. [3]
Stepping: The ability to ‘step’ through your code line by line is perhaps the most powerful aspect of interactive debugging. You can: [3]
Step Over: Execute the current line of code and move to the next, without diving into function calls on that line.
Step Into: If the current line contains a function call, ‘step into’ it to debug the function’s internal logic.
Step Out: If you’ve stepped into a function and want to quickly return to the calling function, ‘step out’ will execute the rest of the current function and pause at the next line in the calling context.
Strategic Logging: Your Application’s Narrative
While interactive debugging is excellent for local development, it’s often impractical in production environments.
This is where robust and strategic logging becomes your eyes and ears.
Effective logging provides a narrative of your application’s behavior, helping you trace issues even after they’ve occurred. [3]
Strategic Placement: Don’t just log everything.
Place logs at critical points in your application: function entries and exits, significant state changes, external API calls, database interactions, and error handling blocks.
Think about what information would be crucial if you had to diagnose an issue without direct access to the running application. [3]
Log Levels: Utilize different log levels (e.g., `DEBUG`, `INFO`, `WARN`, `ERROR`, `FATAL`) to control the verbosity of your logs.
During development, you might enable `DEBUG` logs, but in production, you might only log `INFO` and above to avoid overwhelming your logging system. [3]
Contextual Data: Include relevant contextual data in your logs, such as user IDs, request IDs, timestamps, and specific input parameters.
This helps in correlating log entries across different parts of your system and reconstructing the sequence of events that led to an issue. [3]
Log Management Systems: For modern web applications, especially those deployed in the cloud, a centralized log management system (e.g., ELK Stack – Elasticsearch, Logstash, Kibana; Splunk; Datadog) is essential.
These systems aggregate logs from various services, allow for powerful searching and filtering, and can even visualize log data to spot trends or anomalies. [3]
Performance Profiling: Unmasking Bottlenecks
Performance issues can be subtle and difficult to diagnose.
Your application might be functional, but if it’s slow or consumes excessive resources, it’s still buggy from a user experience perspective.
Profiling tools help you identify these performance bottlenecks. [3]
CPU Profiling: This involves analyzing which parts of your code consume the most CPU time.
A CPU profiler will show you a breakdown of function calls and their execution times, helping you pinpoint computationally expensive operations that need optimization. [3]
Memory Profiling: Memory leaks and inefficient memory usage can lead to application slowdowns and crashes.
Memory profilers help you track memory allocation, identify objects that are not being garbage collected, and understand your application’s memory footprint.
Tools like Valgrind (for C/C++), Py-Spy (for Python), or built-in profilers in Node.js and Java virtual machines are invaluable here. [3]
Flame Graphs and Call Trees: Many profilers visualize performance data using flame graphs or call trees.
These visual representations make it easier to identify hot paths (functions that are frequently called or take a long time to execute) and understand the flow of execution that leads to performance issues. [3]
Static Code Analysis: Catching Bugs Before They Run
Static code analysis involves examining your code for potential issues without actually executing it.
These tools can detect a wide range of problems, from syntax errors and coding standard violations to security vulnerabilities and potential bugs.
Integrating static analysis into your development workflow can catch issues early, reducing the cost and effort of fixing them later. [3]
Linters: Tools like ESLint for JavaScript, Pylint for Python, or StyleCop for C# enforce coding style guidelines and identify common programming errors.
They help maintain code consistency and readability across a team. [3]
Security Scanners: Static Application Security Testing (SAST) tools analyze your code for security vulnerabilities, such as SQL injection, cross-site scripting (XSS), and insecure direct object references. [3]
Code Quality Metrics: Some static analysis tools provide metrics on code complexity, maintainability, and test coverage, helping you identify areas that might be prone to bugs or difficult to maintain. [3]
Memory Debugging: The Elusive Leaks
Memory-related issues, particularly memory leaks, are notoriously difficult to diagnose.
A memory leak occurs when your application fails to release memory that is no longer needed, leading to a gradual increase in memory consumption and eventual performance degradation or crashes. [1]
Heap Analyzers: Tools like the Memory panel in Chrome DevTools (as discussed), or specialized heap analyzers for specific languages (e.g., VisualVM for Java, `heapdump` for Node.js), allow you to inspect the contents of your application’s memory heap.
You can identify objects that are unexpectedly retained, helping you trace the root cause of a leak. [1, 3]
Garbage Collection Monitoring: Understanding how your language’s garbage collector works and monitoring its activity can provide clues about memory issues.
Excessive garbage collection cycles might indicate that your application is constantly allocating and deallocating memory, leading to performance overhead. [1]
Debugging Asynchronous Code: Navigating the Non-Linear
Modern web applications are inherently asynchronous, relying heavily on callbacks, Promises, `async/await`, and event loops.
While this enables non-blocking operations and improved responsiveness,
it also introduces challenges for debugging, as the execution flow is no longer strictly linear. [1]
Async Call Stacks: Browser developer tools and modern debuggers provide
the ability to view the asynchronous call stack, which helps trace the sequence of events that led to an asynchronous operation.
This is crucial for understanding the context in which an asynchronous function was called. [1]
Promise and Async/Await Debugging: Debuggers are increasingly sophisticated in handling Prom
Promises and `async/await`. You can set breakpoints within `then()` or `catch()` blocks, or directly within `async` functions, and step through the asynchronous flow as if it were synchronous. [1
Event Loop Visualization: Understanding the event loop is key to debugging asynchronous issues.
While not a direct debugging tool, visualizing the event loop (e.g., using online tools or mental models) can help you understand when tasks are queued, executed, and how they interact with the call stack. [1]
Dedicated Libraries/Tools: For complex asynchronous flows, libraries like `async.js` (for Node.js) or specialized debugging tools that provide better visibility into asynchronous operations can be beneficial. [1]
Effective Debugging Strategies: Beyond the Tools
Having the right tools is only half the battle; employing effective strategies is what truly elevates your debugging prowess.
These approaches help you systematically narrow down issues and find solutions more efficiently. [1]
Binary Search Debugging: Divide and Conquer
This technique is particularly effective for large codebases or when you suspect a bug was introduced between two known working versions.
The principle is simple: systematically eliminate half of the code to find the source of the bug. [1]
1. Isolate the Problem: First, ensure you can reliably reproduce the bug. [1]
2. Divide: Comment out or temporarily disable roughly half of your code. [1]
3. Conquer: If the bug persists, the issue lies in the remaining active code. If the bug disappears, it was in the commented-out section.
Repeat the process, always narrowing down the problematic section by half, until you pinpoint the exact line or block of code causing the issue. [1]
Rubber Duck Debugging: Talk it Out
This seemingly quirky technique is surprisingly effective.
It involves explaining your code, line by line, to an inanimate object (like a rubber duck) or a colleague.
The act of articulating your code and its intended logic often helps you spot logical errors, incorrect assumptions, or overlooked edge cases that you might miss when silently reviewing the code. [1]
Pair Programming and Code Reviews: Collaborative Debugging
Two heads are often better than one, especially when it comes to debugging. [1]
Pair Programming: Working with a colleague at a single workstation, where one person writes code and the other reviews it in real-time, can significantly reduce the number of bugs introduced and speed up the debugging process.
The constant feedback and different perspectives help catch issues early. [1]
Code Reviews: Regular code reviews by peers are a critical part of a healthy development workflow.
Fresh eyes can spot issues that the original developer might have overlooked, including potential bugs, performance inefficiencies, or security vulnerabilities. [1]
Test-Driven Development (TDD): Preventing Bugs from the Start
While not a debugging technique in itself, Test-Driven Development (TDD) is a methodology that can drastically reduce the need for extensive debugging.
In TDD, you write automated tests before you write the actual code. [1]
1. Write a Failing Test: Write a test that describes a desired piece of functionality and, naturally, fails because the functionality doesn’t exist yet. [1]
2. Write Code to Pass the Test: Write just enough code to make the failing test pass. [1]
3. Refactor: Refactor your code, ensuring all tests still pass. [1]
This cycle ensures that your code is well-tested, modular, and less prone to bugs, as you’re constantly validating its behavior against defined expectations. [1]
Conclusion: Embrace the Debugging Journey
Debugging is an inevitable, and often rewarding, part of the software development journey.
It’s not merely about fixing errors; it’s about deeply understanding your application, optimizing its performance, and ensuring a robust and seamless experience for your users. [1, 2, 3]
By mastering advanced browser developer tools, embracing strategic logging, leveraging profiling techniques, and adopting effective debugging strategies like binary search and TDD, you transform from a reactive bug-fixer into a proactive problem-solver.
Each bug you squash, each performance bottleneck you optimize, contributes to your growth as a developer and the quality of the web applications you build. [1, 2, 3]
So, the next time you encounter a stubborn bug, don’t despair.
Instead, see it as an opportunity to hone your skills, dive deeper into your code, and emerge a more capable and confident developer.
Happy debugging!
References
[1] Nile Bits. (2024, July 29). *15 Powerful Browser Debugging Techniques*. DEV Community. []()
[2] Abhaya. (2024, November 18). *Advanced Debugging with Chrome DevTools*. Medium.
[3] Coughlin, S. (2024, June 7). *Advanced Debugging Techniques for Software Engineers*. Sean Coughlin’s Blog. []()