

As web applications grow in complexity, so does the challenge of ensuring their flawless operation.
Developers today face immense pressure to deliver robust, high-performing applications that provide seamless user experiences.
In this dynamic landscape, mastering advanced debugging techniques isn’t just a skill—it’s a necessity.
It’s about more than just fixing errors; it’s about understanding the intricate dance of your code, optimizing performance, and ultimately, building a more reliable web.
Debugging is often seen as a tedious but essential part of the development process.
However, with the right tools and strategies, it can transform from a chore into an empowering journey of discovery.
This blog post will delve into some of the most powerful and advanced debugging techniques available to modern web developers,
helping you to not only identify and resolve issues more efficiently but also to gain deeper insights into your application’s behavior.
Let’s embark on this journey to elevate your debugging prowess and ensure your web applications stand strong against any challenge.
Videos are added as random thoughts 💭 💭.
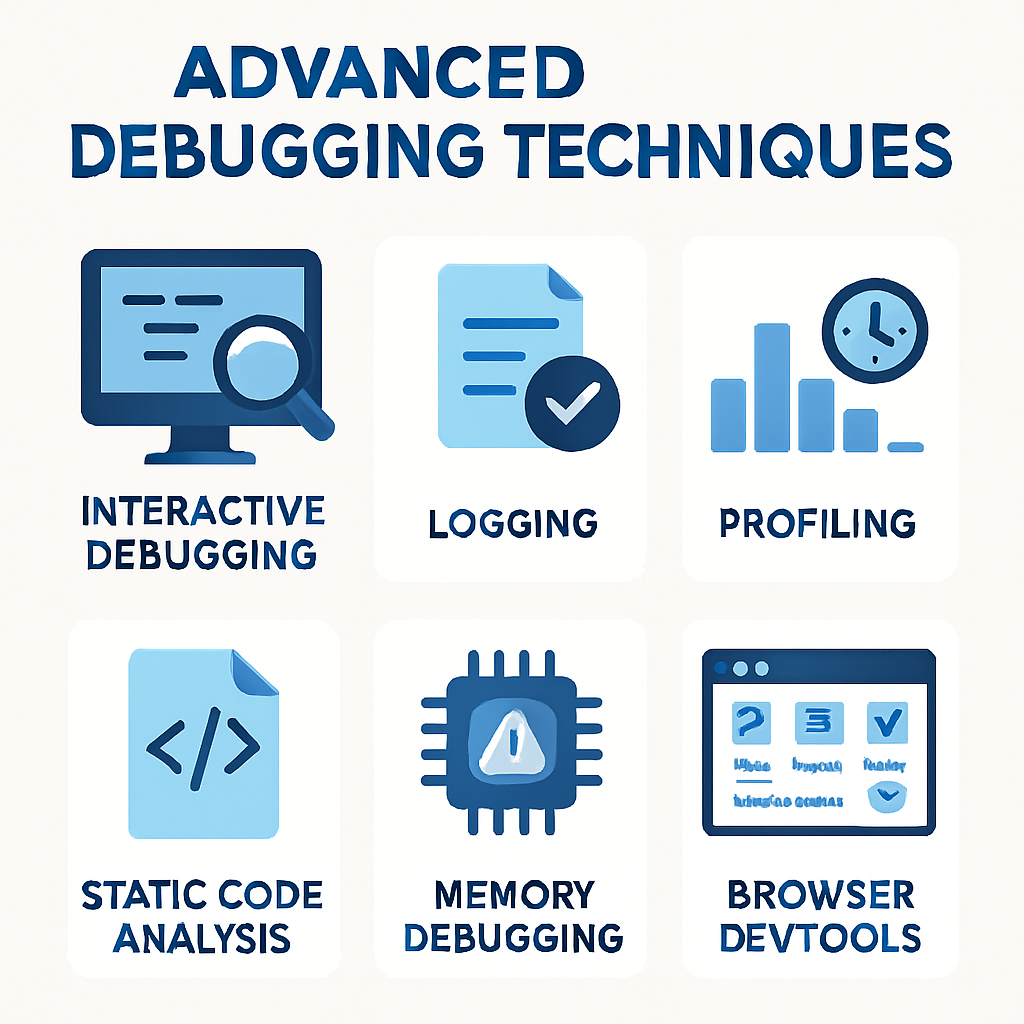
The Power of Browser DevTools
Chrome DevTools, a suite of powerful debugging tools built directly into the Chrome browser, is an indispensable asset for any web developer.
It offers a seamless way to inspect, analyze, and debug front-end code in real-time.
While many developers are familiar with its basic functionalities, truly mastering DevTools involves diving into its more advanced features. [1]
Leveraging the Sources Panel for JavaScript Debugging
The Sources panel is your command center for JavaScript debugging.
It allows you to set breakpoints, step through your code, and inspect variables as your application runs.
Conditional breakpoints, for instance, enable you to pause execution only when specific conditions are met, which is incredibly useful for isolating issues within large codebases.
You can also track variables and expressions using “Watch Expressions” to observe their values change dynamically, providing crucial insights into your application’s state.
Furthermore, the Call Stack feature helps you trace the flow of your code, making it easier to debug asynchronous operations and understand how different functions interact. [1]
Analyzing Network Activity for Performance Optimization
The Network panel in Chrome DevTools is a treasure trove for identifying performance bottlenecks.
By analyzing the flow of data between your server and client, you can pinpoint issues such as slow API responses, excessively large payloads, or unnecessary requests.
A particularly valuable feature is the ability to throttle network speed, allowing you to simulate various network conditions and test your application’s performance under less-than-ideal circumstances.
This ensures a smooth user experience even for those with poor connectivity.
You can also block specific network requests to test fallback scenarios or debug issues related to Content Delivery Networks (CDNs). [1]
Debugging Layout and Rendering Issues with the Elements Panel
For front-end developers, the Elements panel is a go-to for inspecting the Document Object Model (DOM) and the CSS rules applied to each element.
Modern web applications heavily rely on CSS Grid and Flexbox for layout, and DevTools provides visual overlays that make debugging these layouts significantly easier.
These overlays allow you to visualize how elements align and resize across different screen sizes, ensuring your responsive designs behave as expected.
Moreover, the ability to modify styles on the fly directly within the Elements panel allows for rapid experimentation and visual debugging without altering your source code. [1]
Profiling JavaScript Performance with the Performance Panel
Optimizing JavaScript performance is crucial for a snappy web application.
The Performance panel offers deep insights into how your JavaScript code executes.
CPU profiling helps you identify which functions consume the most CPU time, allowing you to target and optimize performance-heavy parts of your code.
Similarly, monitoring frame rendering helps you detect low frame rates, which often indicate computationally intensive tasks that need attention. [1]
Mobile Debugging with Remote Devices
In today’s mobile-first world, ensuring cross-device compatibility is paramount.
Chrome DevTools’ Remote Devices feature allows you to debug your mobile web applications directly from your desktop browser.
By connecting your mobile device via USB or local network debugging,
you can inspect and test your app’s performance, layout, and network issues on actual mobile devices,
ensuring a consistent experience across all platforms. [1]
Beyond Browser DevTools: Advanced Debugging Techniques
While browser DevTools are incredibly powerful, advanced debugging often requires a broader arsenal of techniques.
These methods extend beyond the browser, offering deeper insights into your application’s behavior and helping you tackle even the most elusive bugs. [2, 3]
Interactive Debugging
Interactive debugging, often facilitated by modern Integrated Development Environments (IDEs),
allows you to pause the execution of your program at specific points and inspect its state in real-time.
This includes setting breakpoints to halt execution, watching variables to monitor their values as they change, and stepping through code line by line (step over, step into, step out) to understand the precise flow of execution.
This hands-on approach is invaluable for understanding complex logic and identifying the exact point where an issue arises. [3]
Logging: Your Eyes in Production
Effective logging is a cornerstone of debugging, especially in production environments where interactive debugging might not be feasible.
Strategic placement of logs at key points in your code allows you to capture important events and state changes.
Utilizing different log levels (debug, info, warn, error) helps you control the verbosity of your logs and focus on relevant information.
Furthermore, integrating log management tools like ELK Stack (Elasticsearch, Logstash, Kibana) or Splunk can help you aggregate,
search, and analyze vast amounts of log data, making it easier to trace issues across distributed systems. [3]
Profiling for Performance Optimization
Profiling is essential for identifying and resolving performance bottlenecks in your application.
CPU profiling helps you analyze which functions consume the most CPU time, allowing you to optimize computationally intensive operations.
Memory profiling, on the other hand, helps you monitor memory allocation and detect memory leaks or inefficient memory usage.
Tools like VisualVM and Py-Spy provide detailed performance insights, enabling you to fine-tune your application for optimal speed and efficiency. [3]
Static Code Analysis: Catching Issues Early
Static code analysis tools examine your code for potential issues without actually executing it.
These tools can detect a wide range of problems, including syntax errors, code smells, and even security vulnerabilities.
By integrating static analysis tools into your build pipeline, you can catch issues early in the development cycle, reducing the cost and effort of fixing them later.
Tools like SonarQube, ESLint for JavaScript, and Pylint for Python are excellent examples of static analysis tools that help maintain high code quality. [3]
Memory Debugging: Tackling Elusive Leaks
Memory-related issues, such as memory leaks and buffer overflows, can be notoriously difficult to diagnose.
Memory debugging tools are designed to help you track memory allocation and identify these elusive problems.
Valgrind, for instance, is a powerful tool for detecting various memory errors.
Heap analyzers, such as those found in VisualVM, can help you analyze heap dumps to pinpoint memory leaks and optimize memory usage,
ensuring your application runs efficiently without consuming excessive resources. [3]
Combining Techniques for Comprehensive Debugging
For complex bugs, the most effective approach often involves combining multiple debugging techniques.
You might start by using logging to narrow down the general area of an issue, then switch to interactive debugging to inspect the precise state of your application at the point of failure.
Once the bug is identified and fixed, profiling can be used to ensure that your solution doesn’t introduce any performance regressions.
This multi-faceted approach allows you to leverage the strengths of each technique, leading to more efficient and thorough bug resolution. [3]
Conclusion
Debugging is an art and a science, constantly evolving with the complexities of modern web applications.
By mastering advanced techniques such as leveraging the full power of browser
- DevTools,
- employing interactive debugging,
- strategic logging,
- performance profiling,
- static code analysis,
- and memory debugging,
you equip yourself with the skills to tackle any challenge.
Remember, the goal isn’t just to fix bugs, but to understand their root causes, prevent future occurrences, and ultimately, build more robust and reliable web applications that delight users.
Embrace the journey of continuous learning in debugging, and you’ll find yourself not just a better developer, but a true problem-solving maestro.
References
[1] Abhaya. (2024, November 18). *Advanced Debugging with Chrome DevTools*. Medium. []()
[2] Nile Bits. (2024, July 29). *15 Powerful Browser Debugging Techniques*. DEV Community.
[3] Coughlin, S. (2024, June 7). *Advanced Debugging Techniques for Software Engineers*. Sean Coughlin’s Blog.
log.seancoughlin.me/advanced-debugging-techniques-for-software-engineers)