

Linux systems generate an enormous amount of valuable diagnostic data.
These logs become essential tools for understanding system behavior, detecting issues, and resolving problems quickly.
Both server and desktop environments rely heavily on logs to track performance, failures, security events, and user activity.
This comprehensive guide explores how to use journalctl and syslog to analyze Linux logs effectively.
Understanding the Linux Logging Architecture
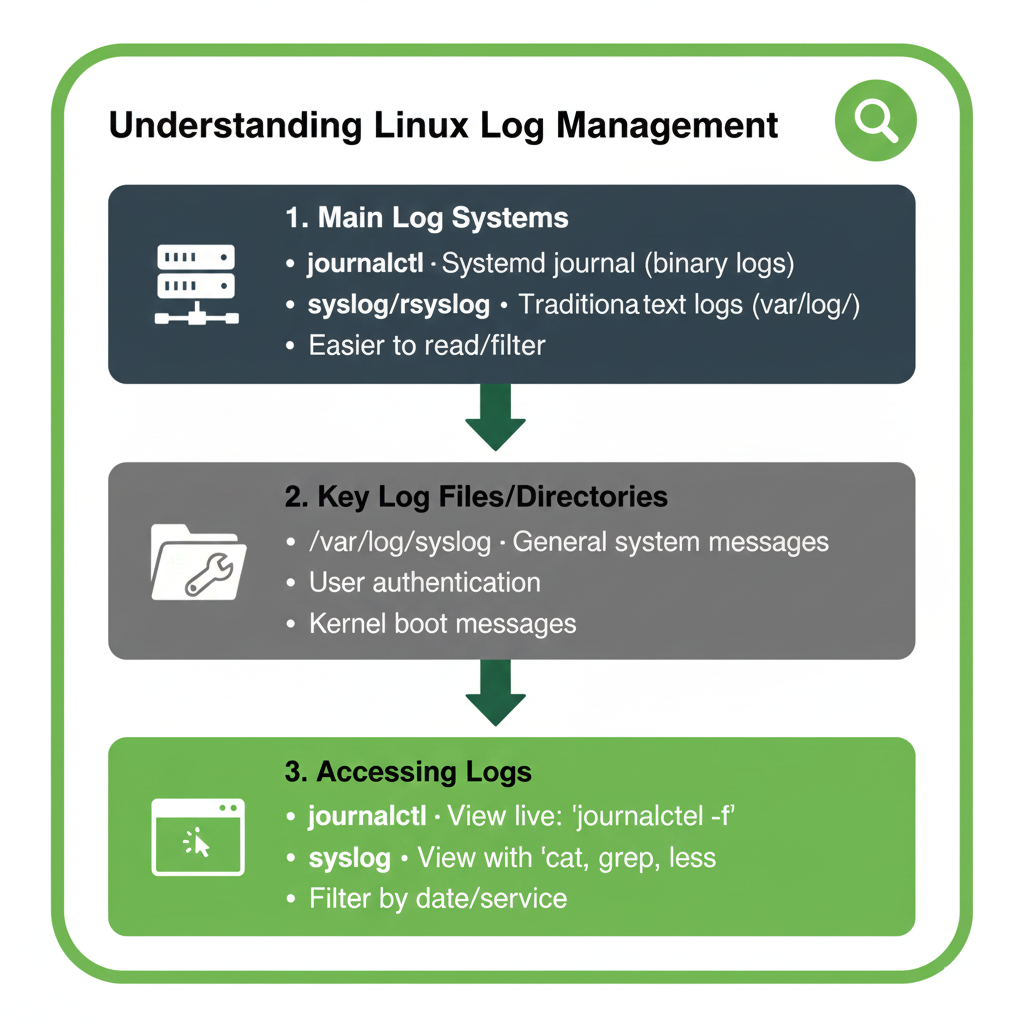
Linux logging revolves around two major technologies.
The first is the traditional syslog system, which stores logs in plain text files under /var/log.
The second is systemd’s journal, which captures structured and indexed logs accessible through the journalctl command.
Key Differences Between syslog and journalctl
While syslog focuses on centralized file-based logging, journalctl provides structured entries with metadata, timestamps, and improved search capabilities.
Understanding these differences helps determine which tool to use for troubleshooting specific issues.
| Feature | journalctl | syslog |
|---|---|---|
| Log Format | Structured Binary | Plain Text |
| Search Efficiency | Fast with Filters | Manual Grep Required |
| Metadata Support | Rich Metadata | Limited |
Analyzing Logs with journalctl
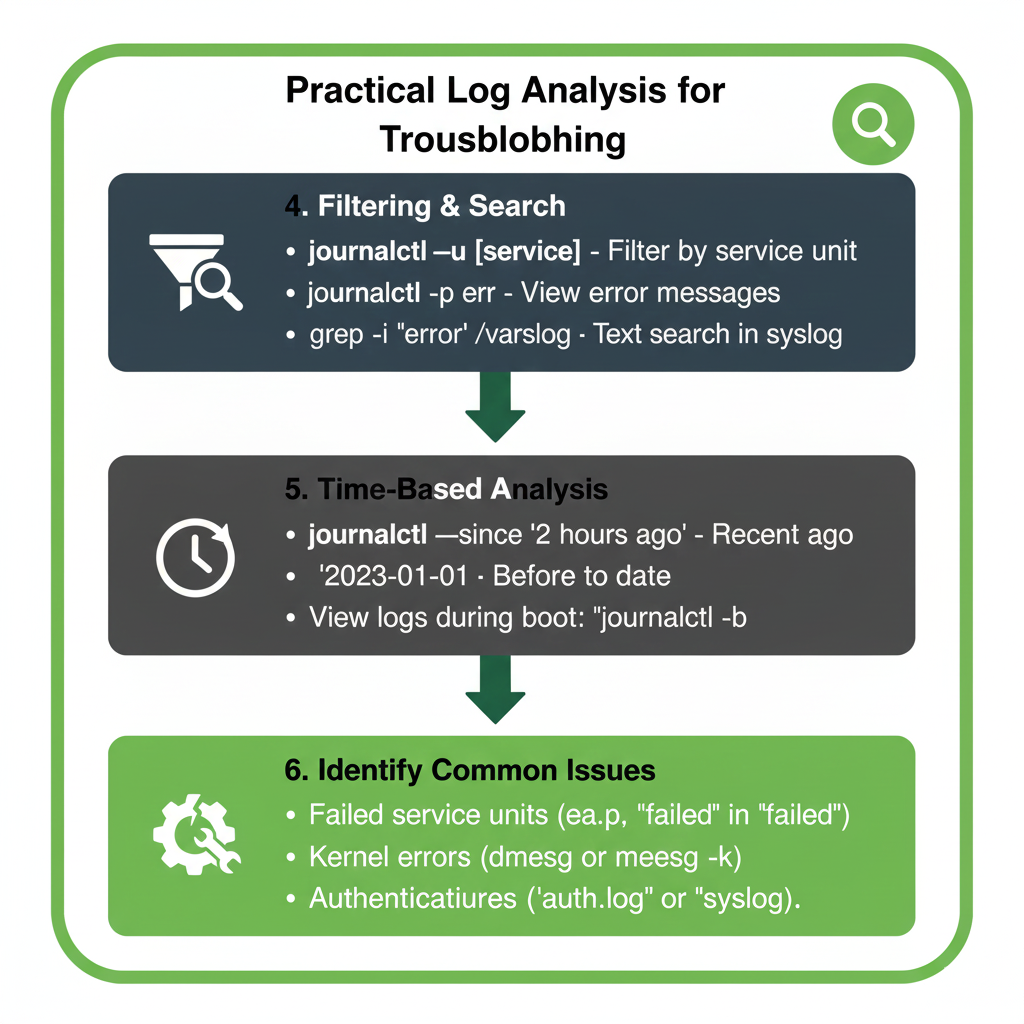
The journalctl command allows filtering logs by time, service, priority, and much more.
This makes it easier to diagnose both simple and complex issues within the system.
Common journalctl Commands
You can view the entire system journal using a simple command.
To follow logs in real-time, journalctl offers a convenient tail-like feature.
You can also filter logs by units such as NetworkManager, SSH, Apache, or Docker.
- View all logs from the current boot session.
- Display logs for a specific systemd service.
- Follow live logs continuously.
- Filter logs by priority to find critical issues.
Understanding journalctl Output
Each journal entry contains timestamps, systemd units, process IDs, and detailed event information.
This structure allows precise identification of errors and warnings.
Filtering by time ranges is especially useful when troubleshooting recent system crashes or slowdowns.
https://youtu.be/nx9i9eKJeNE
Working with syslog and /var/log
Traditional Linux distributions rely heavily on syslog for logging various system and application messages.
Even modern systemd-based systems still include many applications that write directly to syslog files.
Understanding how to read and interpret syslog files is essential.
Important Log Files in /var/log
The /var/log directory contains logs for system events, kernel messages, authentication, package installations, and more.
Knowing where to look dramatically reduces troubleshooting time.
- auth.log — Contains authentication attempts and security-related events.
- syslog — General system messages including warnings and errors.
- kern.log — Kernel-level events helpful for debugging drivers.
- boot.log — Messages during system startup.
Using grep for Faster Log Searching
The grep command is often used with syslog files to locate error messages.
Searching for specific keywords such as failed or error helps isolate problematic entries.
https://youtu.be/XirJ3ZFeL6w
Troubleshooting Common Server Issues Using Logs
Servers rely on logs for diagnosing performance issues, security breaches, and application failures.
A structured approach helps administrators quickly pinpoint the root cause.
Investigating High CPU or Memory Usage
Logs generated by systemd, kernel, and performance monitoring tools can reveal intensive processes.
The journal provides detailed metadata to help identify resource spikes.
Checking service-specific logs often uncovers misbehaving applications.
Debugging Network Problems
Network issues frequently appear in logs generated by NetworkManager or systemd-networkd.
Journalctl’s filtering by unit makes it easy to find network-related diagnostics.
Syslog files also provide timestamped entries for connectivity issues.
https://youtu.be/uznjRVp6i_M
Analyzing Desktop Issues Using Logs
Linux desktop environments produce many logs that help diagnose UI crashes, slow boot times, and hardware failures.
Logs from GNOME, KDE, X11, and Wayland are essential in troubleshooting graphical issues.
Hardware-related events such as disk errors also appear in syslog or journal entries.
Investigating Desktop Freezes
Applications crashing or freezing often produce detailed logs in the system journal.
GPU drivers, display servers, and user sessions all contribute logs for analysis.
Filtering for user-level processes can isolate environment-specific issues.
https://youtu.be/eRAxHyR-3Rk
High-Authority External Resources
Below are helpful external references to deepen your understanding of Linux log analysis.
Systemd journalctl Official Documentation
Ubuntu Server Logging Documentation
Final Thoughts
Linux log analysis is a skill that enhances your ability to troubleshoot and secure both servers and desktop systems.
Mastering journalctl and syslog provides unparalleled visibility into system behavior.
With the right approach and tools, you can resolve issues quickly and maintain system stability.
This guide equips you with the foundational techniques needed for effective Linux log analysis.